Proven Methods for Measuring the Success of Top of Funnel Campaigns
While we all love the powerful returns that we get from retention and bottom-funnel initiatives, best-in-class brands are well aware that attracting new customers is crucial to a business’ long-term growth and success. To do that, you need effective top of funnel paid media campaigns. But how do you properly gauge the success of these campaigns? How do you stomach allocating budget to these lower ROAS campaigns when others are printing money for you? In this blog post, we’ll explore how as a growth marketing agency we approach effectively measuring top of funnel campaigns for our partners, giving you the insights you need to optimize your marketing efforts and drive growth for your business.
The Role Of Top of Funnel Campaigns
First, let’s talk about what we can and cannot expect from top-of-funnel (TOFU) campaigns.
We CAN expect:
- Reach
- Users’ first touchpoints with your brand
- Brand lift
- Low engagement, low CTR
We CANNOT expect:
- High ROAS
- High CTR
- Low cost-per-conversion
While we can’t expect a great return from TOFU campaigns, the fact is, your more profitable campaigns (branded, retargeting, etc.) are never going to grow if you’re not nurturing a larger audience for them.
Typically bottom-funnel campaigns are meant to capture demand, instead of generating it.
That’s where TOFU campaigns come in, but they come at a price. That price is a shift in thinking. Where you ditch the channel-specific attribution methodologies we all know and (sometimes) love, and commit to leaning on channel agnostic marketing metrics like total revenue, total lead volume, and blended CPL and blended CAC. If you measure the success of brand awareness campaigns based on ROI, the results will say the campaigns are tanking. But in reality, you’re building newly generated demand so you can scale your most profitable campaigns.
All this is to say, measuring your ROAS for TOFU campaigns isn’t gauging the success of what those campaigns are really designed to do. Your TOFU campaigns are there to give your more profitable campaigns a larger user base to work with. Let’s talk about how we can successfully measure your top of funnel campaigns next.
Three Methods Of Measuring TOFU Success
Brand Lift
We’re marketers, which means we have approximately 1,846 ways to say the same thing. TOFU is often synonymous with “brand awareness” and reach campaigns when you’re actually building them out in ad channels. While ROAS shouldn’t be your top concern with an awareness campaign, there are important campaign metrics to monitor to prevent wasting ad spend on meaningless impressions.
There are two ways to measure brand lift: conducting a brand lift study or analyzing trends in branded search and direct traffic that correlate with when you ran a brand awareness campaign. We’re going to dig into the latter.
To monitor your brand lift, take note of when your TOFU campaign launched, and look at how branded search traffic (both paid and organic) fluctuated in the time your TOFU campaign has been running compared to the previous time period.
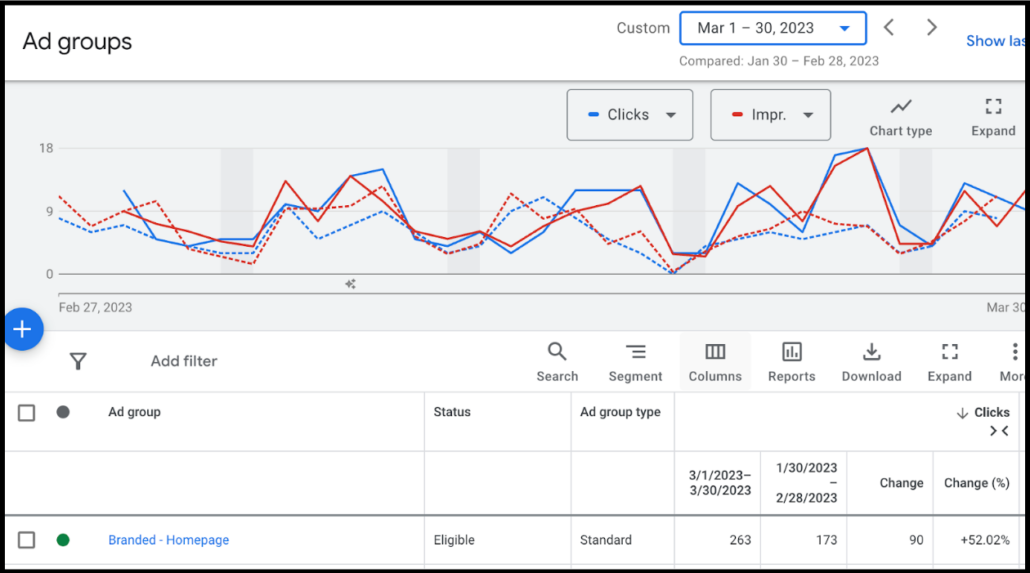
It should be noted that in order to attribute brand lift to your TOFU campaign, there needs to be minimal other variables that might be influencing your brand traffic. Try to maintain your TOFU campaign as an independent variable when using this tactic.
Geo-Testing
While brand awareness is great, the real reason you run a TOFU campaign is for those new impressions to actually turn into customers. However, the amount of touchpoints involved in a transaction or even lead submission make it difficult to discern just how much of an impact your TOFU campaign is having on your bottom line.
To truly identify the potency of your campaign in a vacuum, consider running a geo-test. This method involves only running your TOFU campaign in a select market over a given period of time. Ideally all other elements of your marketing are equal, and your TOFU campaign is the one independent variable that is different about this particular market. From there, simply look at sales and lead fluctuations in that one market versus everywhere else.
Let’s say you typically market to all of North America. But you’re eager to see how your TOFU Meta Ads campaign is doing, so you run a geo-test in Arizona for one month. It’s business as usual everywhere, except in Arizona, where you’re flooding Facebook & Instagram with prospecting ads to users who have never heard of your brand. At the end of that month, let’s say revenue is pretty flat month-over-month across all of North America, but in Arizona you saw a 20% increase in revenue month-over-month. If you’ve truly isolated your TOFU campaign as your independent variable, you can feel pretty confident that your TOFU campaigns are able to push revenue by around 20%.
This method isn’t perfect, as you may see swings in conversion rates across different markets. Even so, it gives you a great sense of top-to-bottom just how effective your TOFU campaign is at generating new customers.
Attribution Models/Conversion Paths in GA4
Don’t be afraid to leverage GA4 in your efforts to understand your TOFU campaign. Within the “Advertising” section, you’ll find the “Attribution” drop down which produces two very valuable reports for making sense of your TOFU efforts: the “model comparison” and “conversion paths” reports.
Let’s start with “model comparison” and chat quickly about conversion attribution models. “Last click” used to rule the reporting world, but with more and more touch points showing up in customer journeys, it’s vital that marketers adapt how campaigns are analyzed. Within GA4, there are many more options than just “last click”. You now can easily toggle between first click, linear, position-based, and time decay.
Your TOFU campaigns are most likely going to be the first touchpoint a user has with your brand. If you want to cut through the clutter and just see how many sales/leads derived from your TOFU campaign acting as the first touchpoint, simply reference this report and toggle your attribution model to “first click” and look for your campaign.
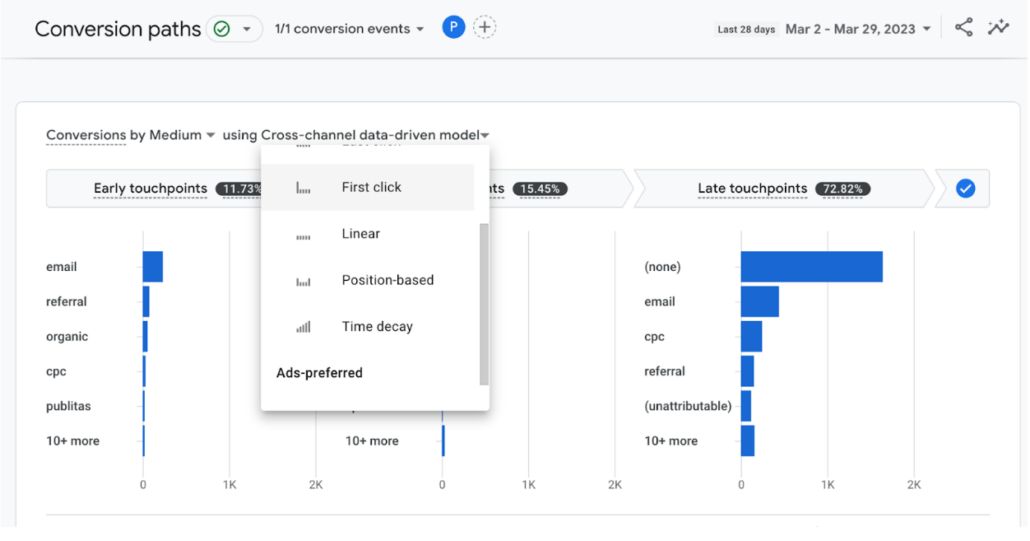
While you’re at it, you might as well look at the other attribution models too and get a sense of how the metrics change between models.
The other valuable report here is the “top conversion paths” report which shows you the precise touchpoints of a given user’s customer journey:
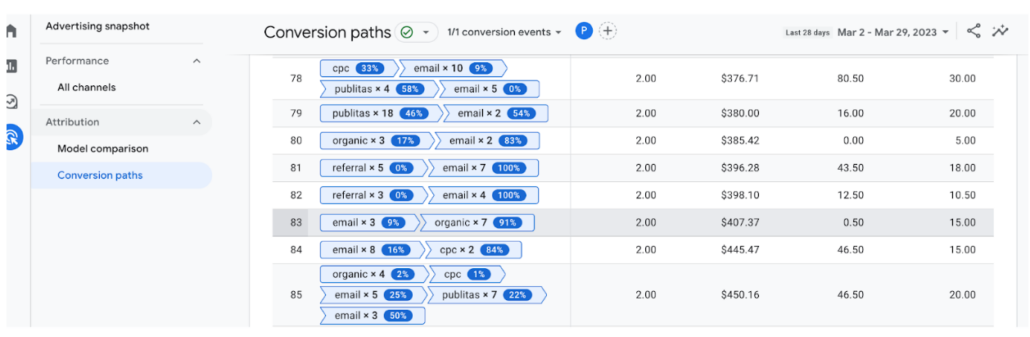
Not only can you get a sense of the numerical value of your TOFU campaigns, but you also get a real look at what sequences are the most successful with all your given touchpoints. “Top conversion paths” is a vital tool to understand where users are going after they interact with your TOFU campaign. It allows you to calibrate your messaging and prime them for future engagement with other ads, pieces of content, emails, etc.
GA4 has a lot to offer in terms of putting your TOFU campaigns under a microscope. However, you need to make sure you’ve set up your account properly in order to get these reports to work.
Get Started Measuring Top of Funnel Campaigns
You now have three methods to give you a better understanding of how well your TOFU campaigns are supporting your business. While these campaigns aren’t meant to produce a clean ROAS directly, they still need to be supporting your bottom line. Don’t let the extra steps stop you from getting to the bottom of your performance. Knowing how to harness your top-of-funnel campaigns is what separates the best-in-class brands from the rest of the pack!