How We Decreased Pathstream’s CAC by 59% YoY
When we first started working with Pathstream – a Series A startup that offers online certification programs that help people level up their careers, they were spending nearly $1m each quarter in ad spend to hit their lead volume goals, but with a ROAS right around 1.10. They were hitting their application targets, but they were breaking even doing it.
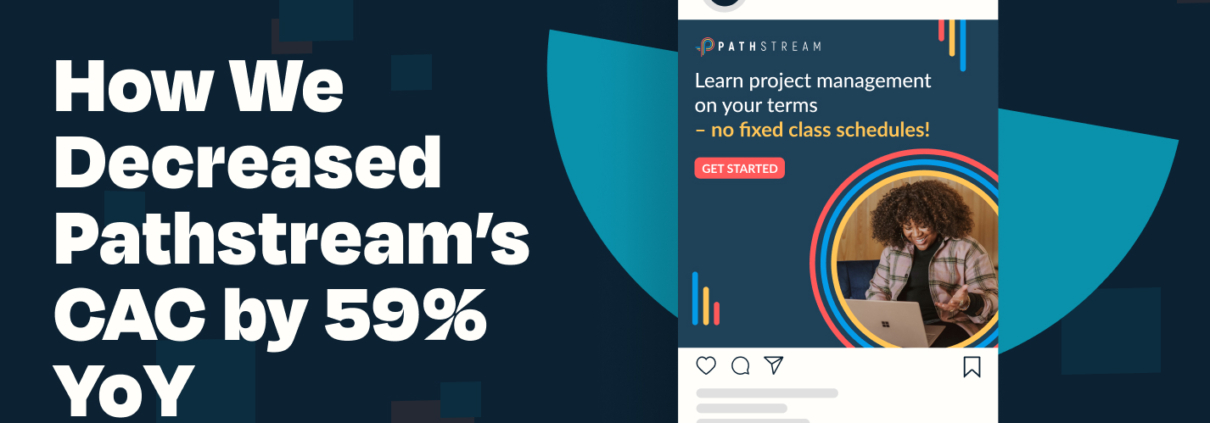
By restructuring ad accounts, testing creative, audience targeting, and different conversion events, we were able to help decrease Pathstream’s CAC by 59%, leading to their most efficient quarter ever and hitting their ideal LTV to CAC ratio for the first time.
For 80% of our partners, we take a blended approach to reducing CAC – we focus on decreasing costs on ad channels to send more traffic to the site with the same amount of money, and we create a CRO strategy to improve website conversion rates.
The exception? When development capabilities are limited or a partner has a custom CMS. That was the case for Pathstream. We weren’t able to implement robust CRO tests in order to improve CAC – we had to get creative when it came to optimizing Facebook and paid search campaigns on Google to hit those CAC targets.
When we first partnered with Pathstream, a majority of their ad spend was dedicated to Facebook ads, but the cost per lead, cost per application and cost per enrollment were extremely high and they knew they needed to drive these costs down in order to keep investing a large majority of their paid spend into Facebook.
With this goal in mind, our social ads team immediately started diving into the Pathstream ad accounts and analyzing the existing data to identify opportunities or “quick wins” as we call them, while also simultaneously working on a longer term strategy for driving down Facebook costs.
Here’s a sneak peak of how we drove down their Facebook CPL by 63% year over year.
Testing new audiences
We tested a handful of new audiences over the past year for Pathstream from job titles, to interests, demographics and lookalikes. We found that our most successful audiences were based on interests for specific Pathstream programs (Asana, Salesforce, Digital Marketing, Data Analytics) and a lookalike of 5% based off of previous Pathstream students who have enrolled in one of their certification programs.
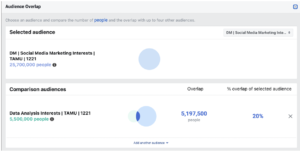
Since some of the program interests we were targeting could possibly have overlap (Example: Digital Marketing and Data Analytics), we used the audience overlap tool to ensure that the overlap wasn’t greater than 40% so that our program specific audiences wouldn’t be bidding against each other.
After we discovered that these were our top performing audiences, we tested a combination audience that targeted both the interest audience and the lookalike in one ad set. This ultimately did not perform as well as the two audiences segmented out into their own ad set. Based on this learning, we segmented each audience back into its own ad set and set the budget at the campaign level which allowed Facebook to allocate the daily budget to the audience with the lower cost.
Optimizing for Higher Funnel Conversion Events
When we first launched campaigns, we were extremely focused on driving down the cost per enrollment, so all of our campaigns were optimized toward the “purchase” conversion event. We soon realized that most Pathstream students don’t immediately enroll in a program when they first find out about Pathstream. In fact, it could take weeks or even a month for someone to enroll in a Pathstream program after first expressing interest.
This led us to switch up our optimization strategy and test out a higher funnel conversion event (submit application), which fires once someone enters their information, becomes a lead and also completes a quick application.
By switching to a higher funnel conversion event, we were not only able to increase the total number of applicants, but we were able to drive down the cost per impression, cost per click, cost per lead and cost per enrollment by bidding on a higher funnel action –– which is less expensive and in return gives the Facebook algorithm more data to target users likely to submit an application.
Developing new conversion-driven creative
A large part of our Facebook strategy we put together in our initial research for Pathstream included new create asset ideas based on a creative analysis we pulled together with what’s working well and what’s not resonating as well with the Pathsream audience.
💡We create data-driven ad creative at Tuff, and have an entire blog post about how we approach that for our partners. Check it out here!
We wanted to test a mix of image and video assets that showcased Pathstream’s value props in an engaging way that would get our audience to click on the ad. We tested a combination of school-branded assets and pathstream branded assets and found that all of the assets that mentioned “100% online” and “get a project management/digital marketing/salesforce certificate” in 6 months were our top performing static ads.
We also tested UGC style videos (like this one) and saw a 56% increase in CTR and decreased the cost per lead by 37% once we rotated those into our campaigns.
Paid Search
With an ad account this large, we ended up restructuring campaigns twice since we started partnering with Pathstream.
Phase 1 Account Restructure
Initially, Pathstream had over 30 different Google Ad accounts they were running campaigns from. Pathstream partners with different universities to offer their certification programs covering curriculum on Facebook Digital Marketing, Salesforce, Tableau Data Analytics, and Asana Project Management. They had a separate ad account for almost every university + certification program combination.
Our first step was combining the campaigns across 30 ad accounts into one to increase the amount of lead data in one ad account to make the Google algorithm work smarter for us.
Even though we culled down campaign structure significantly in phase 1 of our account restructure, we still had over 40 different search campaigns, each with minor differences.
There’s nothing inherently wrong with this approach. Many partners have similar account structures and are certainly successful, and Pathstream was finding success early on with this approach as well. With the goal of getting CAC even lower though, we set out to restructure things again after a few months.
Phase 2 Account Restructure
At this point, we were utilizing many automated, conversion focused aspects of Google Ads. Max Conversions bidding strategy, Data Driven Attribution, Dynamic Search Ads. With these campaign features, Google works best when there is an abundance of data, specifically conversion data flowing into each campaign.
If campaigns are too spread out, only receiving a few conversions per month, you may be underutilizing the true power of automation. This was partially the case for Pathstream.
By condensing campaigns from 40+ to 15, we allowed more conversion data to feed into fewer campaigns, in turn making our ads more efficient. We did not limit targeting. This was not designed to decrease our volume or impression share at all. We were not looking to lighten our workload either. Instead, limiting the number of campaigns gave Google more conversion signals, gave Tuff more opportunity to experiment and learn quickly, and also allowed for better informed expansion across channels in the future.
For starters we left our highest performing campaigns alone. The ones bringing in the most conversion volume and most search volume remained mainly untouched. The big changes were with the campaigns that had the least amount of monthly search volume. Many of them we grouped together into a catch all campaign. What was 10 separate campaigns all converting only a few times a month became one larger structure that converted much more often as a whole.
Only 3 weeks after our account restructure we saw these results:
- Conversion Rate increased 26%
- Cost Per Lead decreased 38%
- CPC dropped 21%
- CTR increased 8%
This was only the beginning. Performance continues to improve week over week while we gather more data in a much less congested structure. From here, we can start to expand our reach by efficiently pivoting what is working best for us in the short term and beyond.
Have a complicated Google ad account structure you could use a second set of eyes on? Or need help reducing your costs on Facebook? We’d love to help!

Kristin is a senior growth marketer and COO at Tuff. After working in a variety of agency landscapes, Kristin found her way to Tuff to work with teams who make make marketing decisions rooted in data and tied to revenue growth. When she’s not building growth strategies or working with the Tuff team to improve our processes, you’ll find her chasing her two kiddos around the house or playing fetch with her dogs.
