
Conducting A Content Inventory Audit With Quartiles [Free Template]

As a content marketer, it’s essential to know the ins and outs of your website content in order to create a successful content strategy.
Content audits are a great way to take stock of what content does and doesn’t exist, so you can better understand your site’s strengths and weaknesses. Using quartiles and a composite score, you can identify the content that is most powerful and worth building upon.
In this blog post, we’ll walk through how to conduct a content inventory audit using quartiles to uncover the most powerful content on your website.
What is a content inventory audit?
A content inventory audit is an analysis of your content marketing strategy. It involves taking an inventory of all of your content assets, such as blog posts, articles, videos, infographics, and other forms of content.
It is helpful for content marketing because it allows you to identify what content is working, what isn’t working, and what content needs to be improved or removed. It also helps you identify any gaps in your content and plan a strategy for filling those gaps.
Additionally, it allows you to track the SEO performance of each piece of content, so you can better understand what content is driving the most engagement and conversions.
What is the goal of a content inventory audit?
The goal of a content audit is to be able to identify the best-performing content on your website or a competitor’s website so that you can figure out how to improve on it. This will make it easier to find content gaps between you and your competitors.
How to conduct a content inventory audit
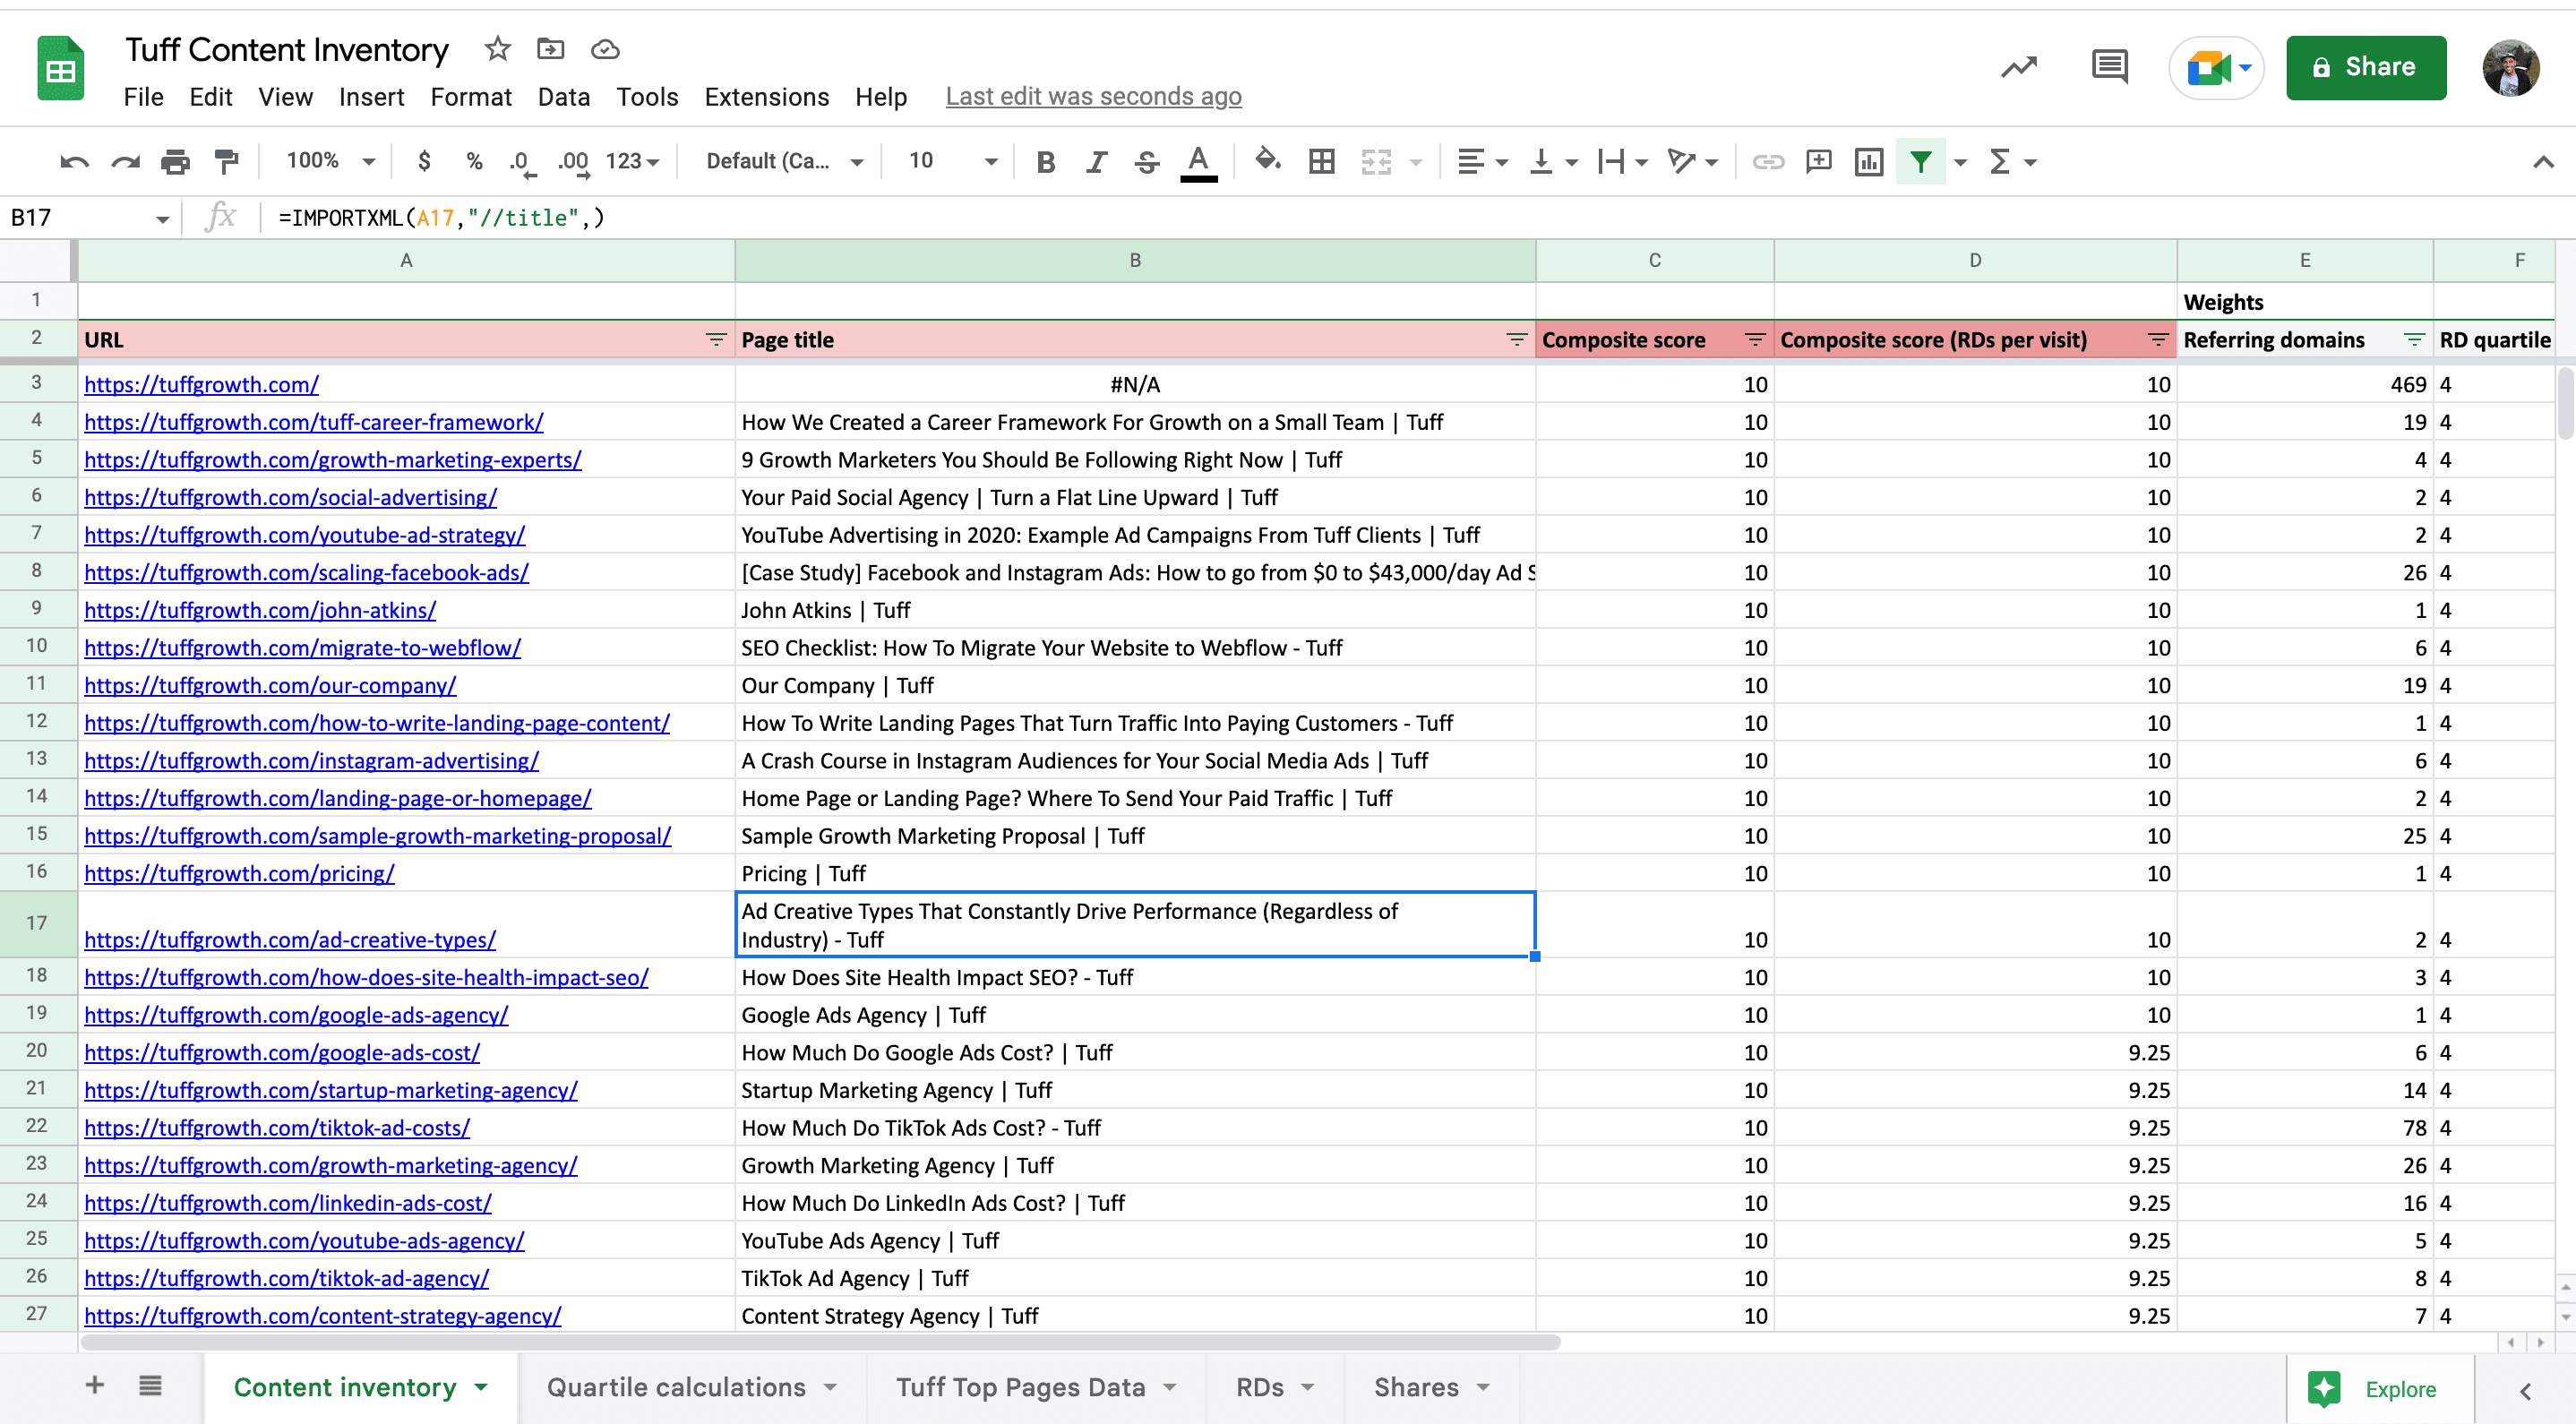
The first step in building a content audit spreadsheet is gathering data on your existing content—KPIs of blog posts and landing pages—and organizing it in Google Sheets.
The KPIs will differ for everyone but I’ve listed a few common ones below. Keep in mind that you may have to pull this data from multiple analytics tools and use a Vlookup to merge it together in a spreadsheet depending on what KPIs you’re pulling. I pulled my data from SEMrush, Google Search Console, ahrefs, and Google Analytics. If you’re using a content management system like WordPress with the appropriate plugins then it may be possible to export all the data from there. If you’re crawling a competitor’s website then ScreamingFrog is a great options as well.
- Webpage URLs
- Shares
- Referring domains
- Organic traffic
- Keyword rankings
Be sure to track KPIs that you’re actively optimizing for. This doesn’t work well if you have a lot of cells with a value of 0 in the spreadsheet and it will skew your data. So if the majority of your blog posts get 0 shares, don’t include it as a KPI.
Unlike most SEO exercises, we’re not too concerned with the SEO page title or meta description in this auditing process.
Once you have all your data, the next step is to build quartiles.
Building Quartiles
If you’re familiar with statistics and the five-number summary then you’re familiar with quartiles. If not, here’s a quick explainer.
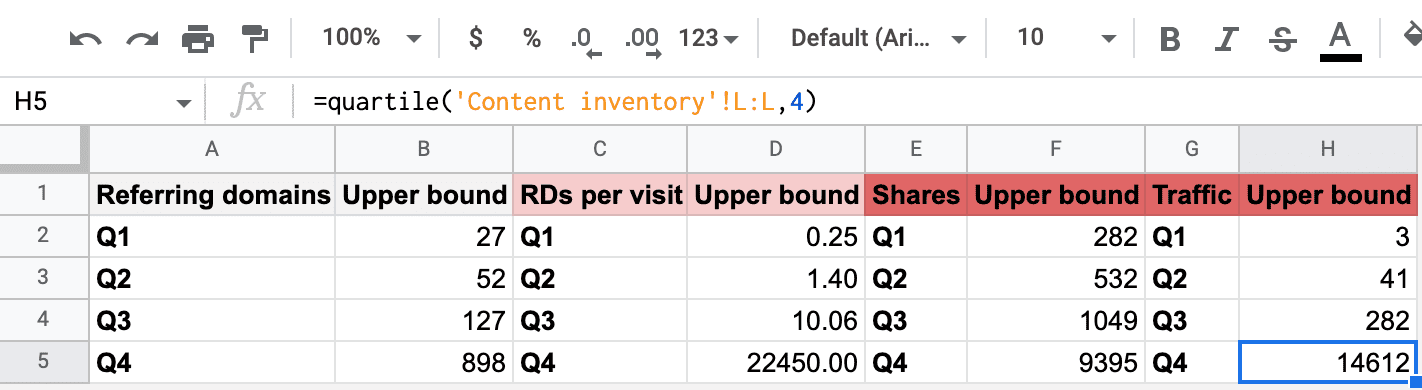
Quartiles are the three points that divide a data set into four equal parts. The first quartile (Q1) is the middle number between the smallest number and the median of the data set. The second quartile (Q2) is the median of the data set. The third quartile (Q3) is the middle number between the median and the highest value of the data set.
- Quartile 1 starts with the bare minimum—0 and creates an upper bound of X, based on historical KPI data. Anything in quartile 1 is your lowest-performing data—unless you haven’t done a time-based analysis on it yet, which I’ll get into later.
- The upper bound of quartile 2 will be your median.
- Quartile three is above average and quartile 4 is your best-performing content.
- This gives you more perspective and allows you to quickly compare and benchmark your KPIs at the page level.
Building quartiles is essentially calculating, benchmarking, and grouping your content into four different buckets based on key performance metrics. These performance metrics will vary depending on which KPIs you’re tracking.
Benefits of quartiles
Quartiles give us a better way of tracking content performance without obsessing over the numbers. For instance, whether a post gets 120 clicks or 130 clicks is not what is most important but being able to consistently produce content that ranks in quartiles 3 and 4 is what your goal is and what is most important.
Having quartiles for different metrics helps you filter out the outliers. A page might look like a top performer because it has hundreds of backlinks, but if the traffic doesn’t match then most likely those are low-quality backlinks.
What can you see in the data
So now that we have quartiles, what can we derive from the data? Let’s take a look.
By analyzing the referring domains quartile and traffic, we can calculate how many referring domains we have per visit. The higher the number, the lower the quality of referring domains. This can be really helpful when looking at competitor content and deciding which content generates the most healthy backlinks.
How to find the most successful content?
All of this still doesn’t tell us what the most successful content is yet. So, how do we find that?
The template includes a composite score and allows you to change the weight of each KPI so that you can weigh your backlinks as more important than your social shares, and vice versa.
The composite score is based on the four different quartiles and the referring domains per visit. The template also gives you the ability to weigh each metric to get a more accurate rating of what is most important to you.
Content audit template
Since I couldn’t find a content audit tool that handles this work for me, I found the next best thing—a template. And I’m sharing it with you! Click the link below and make a copy.
Takeaway
A website content audit using quartiles and composite scores can be a powerful tool for discovering the most impactful content on your website. By tracking the performance of each piece of content over time, you can identify the content that is driving the most traffic, engagement, and conversions. By leveraging this data, you can focus your content strategy on the content that is working and create more of the kind of content that will have the greatest impact on your website.
Next Steps
What to know how you can take your content audit to the next level? You might notice that something is missing. Something that can improve the accuracy of this template. What is it? Time!
Stick around for part 2 of this blog post where we walk through how to conduct a time-based content analysis.

Derek is a digital marketer based in Boston, Massachusetts with almost a decade of hands-on SEO experience. He finds it meaningful, challenging, and exciting to develop, test, and implement new SEO strategies. When he’s not auditing websites and optimizing content he’s usually backpacking and exploring new cultures.