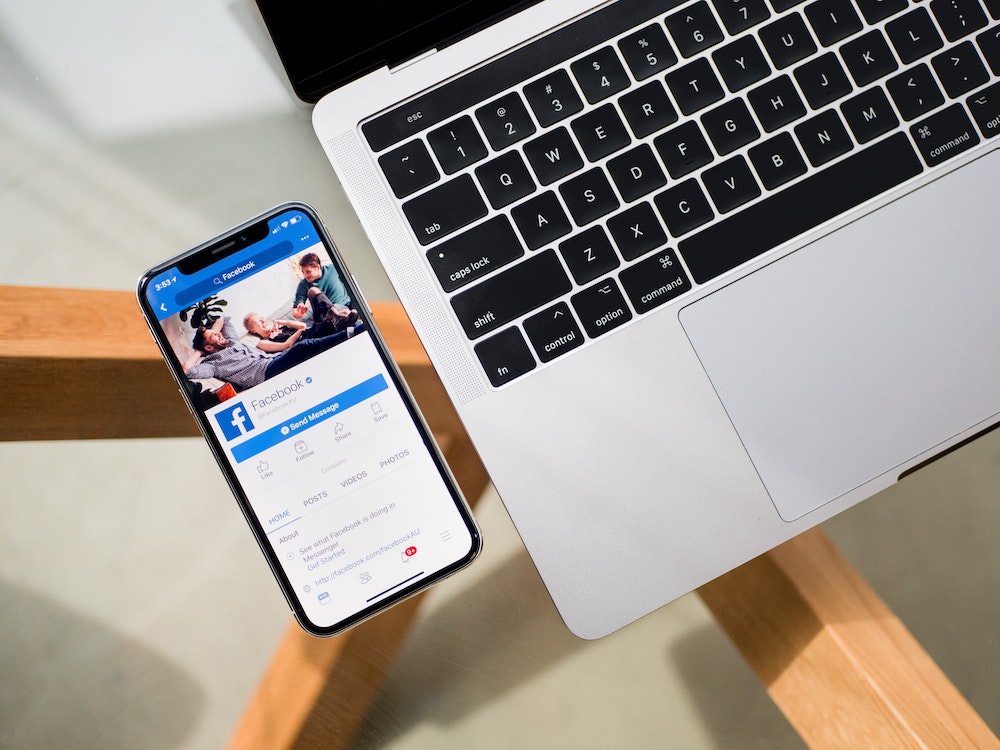
[Case Study] Facebook and Instagram Ads: How to go from $0 to $43,000/day Ad Spend on Facebook in 60 Days
Crunch time. An App partner (iOS & Android) needed to get a massive volume of installs ASAP to support a critical holiday important for their annual revenue and new customer acquisition.
Over 60 days we went from $0 to $43,000 per day ad spend on Facebook & Instagram. Along the way we helped the app achieve its best revenue day ever, tripled their Instagram following (a positive side effect of the massive spend, and engaging ad creative), and brought in millions in lifetime value (LTV), all while keeping cost per install (CPI) on target.
We’ll be using “CPI” a lot in this article, so take a moment to sear its meaning into your brain before you read on. Say it with me: “CPI = Cost per Install”
Here’s what’s included:
- Overview
- Campaign Setup and Results Summary
- Days 1-30: Testing to Find Facebook Ads, Audiences, and Settings that Scale
- Creative that Scale
- Audiences that Scale
- Ads Settings that Scale
- Tracking Troubleshooting
- Days 31-60 The Ramp Up and Final Push
- More testing; audiences, creative, and settings
- Push Budgets to Winners
- Event Specific Creative Push
- Emergency! Account Spend Limit Hit & Workaround
- Emergency! App Stability
- Final Push and Rising CPI
- Summary
- Top Ads
- Performance
- Final Assessment and Key Takeaways
Campaign Setup and Results Summary:
- The Client: iOS and Android App with in-App Purchases
- Primary Channel: Facebook and Instagram App Install Ads
- Supporting Channels:
- iOS App Store Ads
- Google App Install Ads
- Pinterest App Install Ads
- Email (To drive in-app purchases and user-adoption post install)
- The Geo: 🇺🇸
- The Results:
- 60 Days
- $263,000 Spend
- 97,975 Installs
- $2.68 Cost per Install (CPI)
- 9.2m Facebook Reach
- 26.8m Facebook Impressions
- Best revenue day in company history
- Bonus Performance Metrics
- 2.1m video views
- 54,000 post reactions
- 11,000 post shares
- 6,000 New Instagram followers
- Multiple ad variations went viral
- Featured in the App Store
- Bonus Performance Metrics
Days 1-30: Identify Facebook Audiences, Creative, and Settings that Will Scale
After an initial planning, strategy, and goal alignment phase we jumped in. In order to protect costs and efficiency, we spent the first 30 days testing creative concepts including layout variations, and ad copy; we tested 68 audiences, and different bid optimization strategies. This section will get into what and how we tested in the first 30 days.
Finding Creative the Scales
We went through years of creative in the Facebook Ads Manager and identified ad variations and their attributes of top past performers. We looked at metrics like click through rate (CTR), cost per install (CPI), ad quality metrics and more to identify top ads. We looked at the ads copy, creative, CTAs, and ad formats (single image, carousel, and video).
This research revealed:
- Top formats: Carousel, Single Image, Video
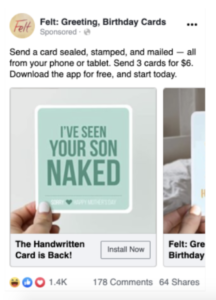
- Top creative: was explanatory or had humor
- Top Audiences were list and event based lookalikes
The research resulted in 12 ad concepts to be paired with the different ad formats and creative. We used existing client creative, and worked with their design team on new creative options.
Creative testing leaned on Facebook’s algorithm to serve the ad variation that would work best. Ad sets typically had 2-6 creative variations, and the Facebook algorithm would move budget to top performers, but the Facebook Algorithm didn’t work alone.
The Tuff team would monitor ads daily, and turn off any ad variations or ad sets that had high CPI. This would force Facebook to spend more on the other variations, which sometimes would go on to become winners.
Audience Research
The audience investigation was similar. What audiences had the best performance metrics? Were they segmented by age, gender, or geography? Were there exclusions (users specified not to receive an ad, e.g., existing app users?)
Though we had initial ideas on what audiences would perform well, seeing historical audience performance, gave us a running start on audience development.
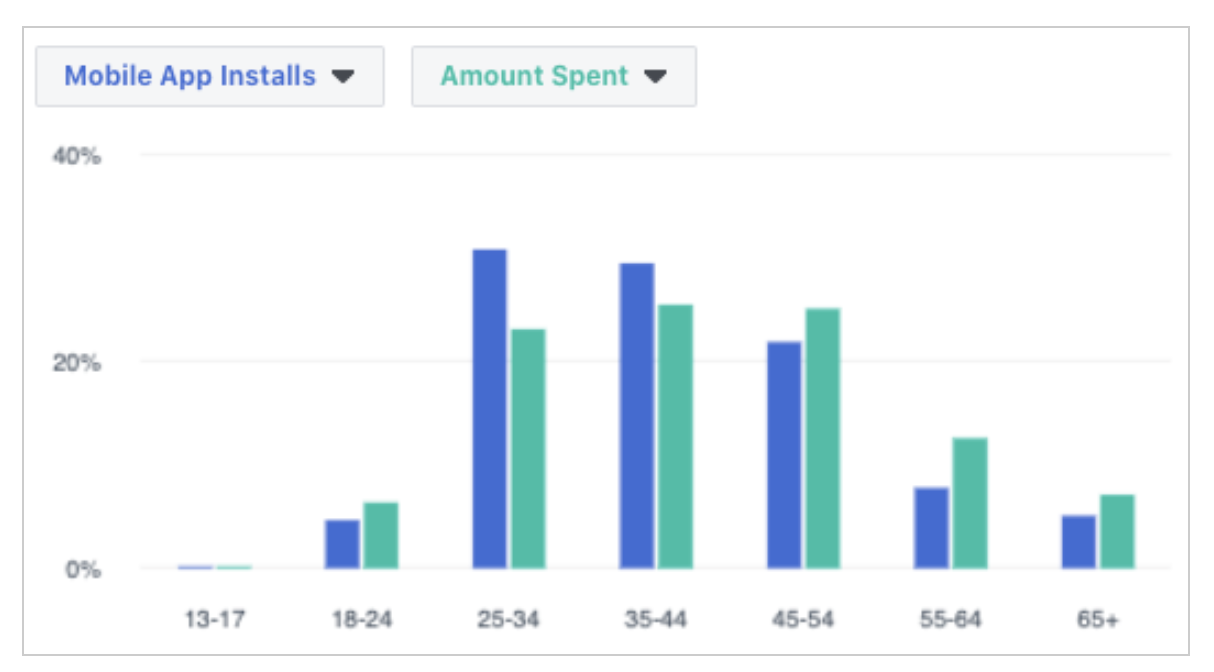
For early learnings we looked at Facebook Demographic reporting in the Ad Account Overview. By Looking at Mobile App Installs compared to Amount Spent, we were able to identify which demographics were likely to have the best performance. In this instance we’re looking at the ratio of mobile app installs to amount spent by age group. To note, this trend didn’t hold through the 60 day push, so it is important to continue to target all ages so opportunities for installs aren’t missed.
Note: Audiences are selected at the Ad Set level in the Facebook Ads Manager. At times in this Facebook case study, you may hear audiences and ad sets used interchangeably.
Generally, the Facebook campaign structure is as follows:
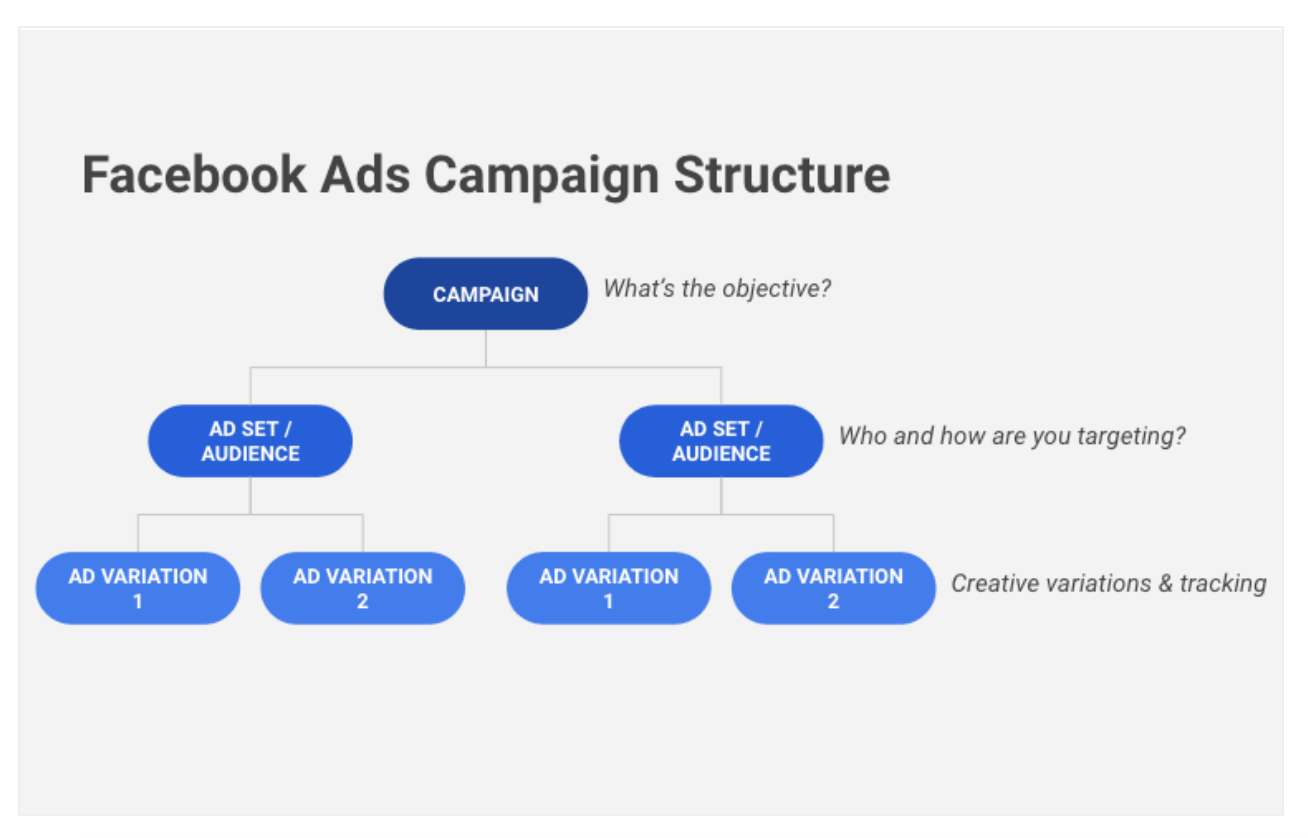
In the first 30 days we tested 63 audiences, paired with a mix of creative. For our tests, we’d typically have 4-8 ad sets per campaign, and 2-6 ad variations per ad set. Over the course of the test period we would turn off underperforming ads and ad sets to push more spend to winning mixes of audiences and creative variations.
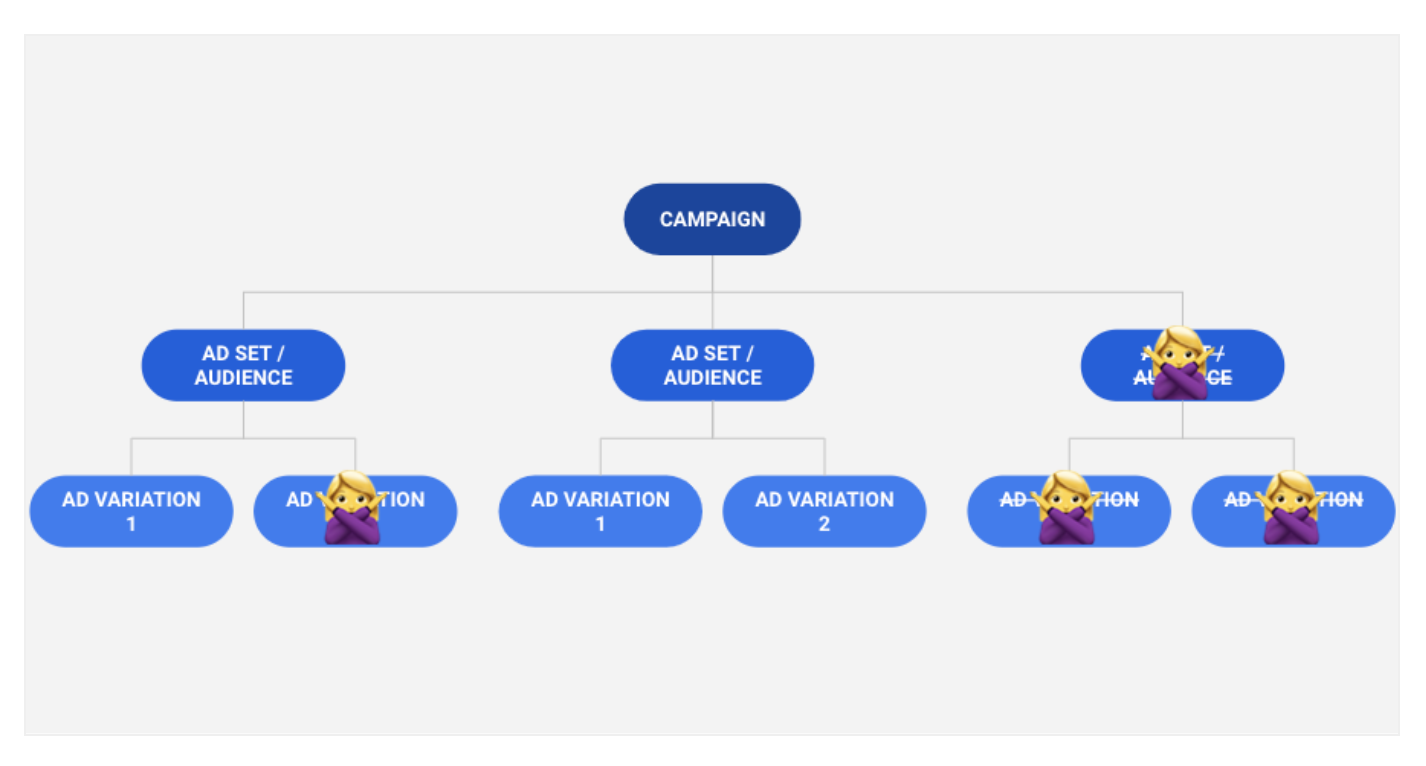
As Facebook Ads performance data came in ads and ad sets we’re turned off, signified in the chart above by “🙅♀️”. Only about ¼ of our ad sets survived month 1 testing, and 3 creative variations (of 12) rose as top performers.
Days 1-30 Summary
TESTED
- 21 Campaigns
- 63 Ad Sets
- 12 Ad Variations
RESULTS
- $9,821 Spend
- 7044 Installs
- $1.39 CPI
- Three top creative variations identified
- 15 core audiences identified
- Cost-cap bid strategy identified as effective at this scale…
…but would it last?
Days 31-60 The Ramp Up
With top audiences, creative, and bid-strategies identified we were prepared to ramp up spend. On day 31 we had 3 campaigns live, 5 audiences, and the top three ad variations running. We spent $950 that day. From there we inched up budget at the ad set level daily, and by day 45 we hit the $2,000/day mark.
More testing; audiences, creative, and settings
Although some audiences didn’t succeed in the 30 days, there was a chance it was due to the creative and ad settings mix. We ensured these previously tested audiences were given a chance to be paired with top creative and ad settings.
During this period the client continued to develop new creative, and that was tested as well using the assistance of the Facebook algorithm. We also isolated some creative to guarantee Facebook spend.
A big driving force behind this rapid Facebook Ads ad spend ramp up was a holiday important to our client’s business, and we wanted to ensure that creative specific to the holiday was served. We tested 10 holiday ad variations, and only one version took off. It would become one of our best ads for the entire 60 period, though it underperformed two non-holiday specific top ads.
An interesting take away from the top three ads is that the event specific creative didn’t perform as well as more general app functionality ads. This may be due the holiday not being applicable to everyone who sees it.
Here is the top event-specific ad. It was a carousel and showcased the product offering. More on how they ad variation performed in the results and summary section.
With top audiences and creative identified we were ready push spend way up leading up to the holiday, however, the the path to spend ramp up we encountered two speed bumps.
$5,000 Ad Account Spend Cap Hit & Workaround
Did you know Facebook has a default $5,000 ad spend cap per ad account, even on established ad accounts? That’s right! This spend cap is different from the ‘spend limit’, and can only be increased by Facebook Support. Unfortunately, support can have a several day turn around, which would be after our peak push.
In this instance, we were able to find an immediate workaround that allowed us to keep advertising. We created new ad accounts. With each ad account having a $5,000 cap, we created 6 additional ad accounts that would take us up to the $35,000 per day in spend.
We did finally hear back from Facebook Support and get the spend limit increased, but this was a good stop gap measure to keep ads rolling.
App Stability Issues
With this massive ramp up underway the app encountered some stability issues due to the influx of new users. This led to a temporary pause on campaigns while app capacity was addressed.
The takeaway from this experience is that if you are undertaking a massive app install or web traffic push, have the app and website stability on your radar. How many users can your app support? Who and how will stability be addressed if there’s a crash?
Thanks to the app’s solid team of developers, app stability issues were resolved quickly and the ramp up would continue.
Final Push and Rising CPI
The final push up to $43,000 was made possible by attention to detail and willingness to sacrifice CPI for more spend around the important holiday.
As we spent more in the final days of the campaign, CPI rose as well. We followed our earlier approach of pushing budget to top ad sets and creative variations, and some of these groupings had literally hit their limit (See $5,000 account cap section above).
The cost cap bid optimized campaigns also weren’t spending their full daily amount as Facebook struggled to find users at the cost and volume we had set forth, so most campaigns were switched to a lowest cost bid strategy, which contributed to rising CPI. Low cost bid optimization, however, increased volume and ensured campaigns would spend their set amount daily.
Fortunately the increased CPI in this final push was acceptable because the volume of installs, and subsequent LTV supported the costs.
Summary
Top Three Ads:
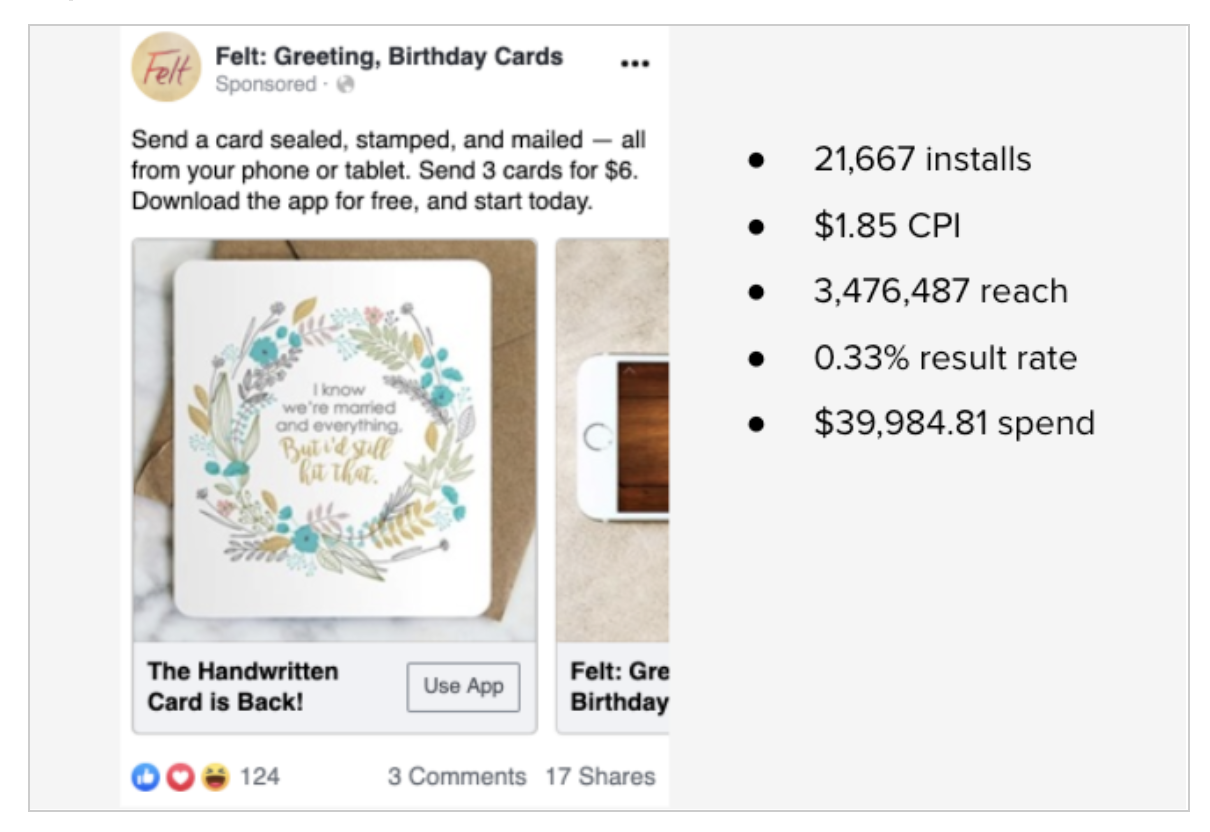
Our top ad was a carousel. Carousels are known to do well on mobile devices, because they can be used to convey information without the bandwidth of video. This particular ad was also highly engaging and received thousands of reactions and 100s of shares over the course of the campaign.
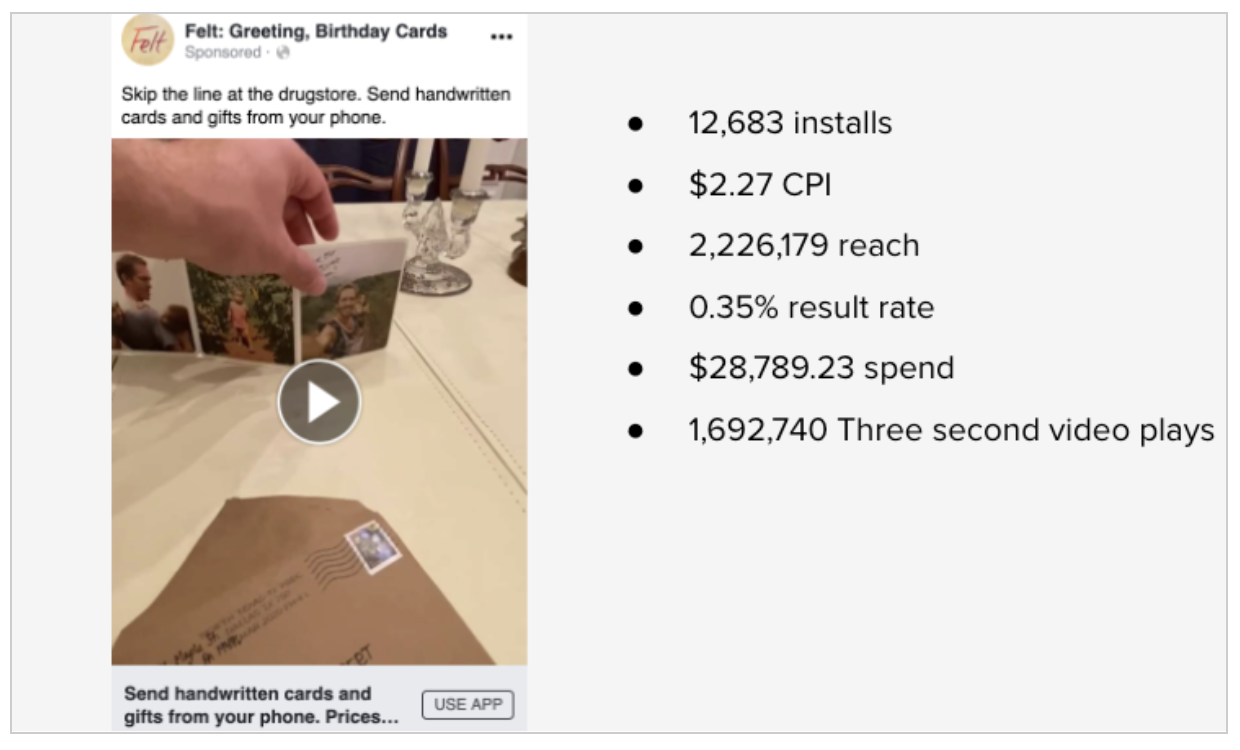
Our second best ad was an informal video shot on an iPhone, that shows the end product of the app (a physical card and gift). This video was paired with concise text and a headline on what the app does. The informal nature of the video may have been what made it resonate with people.
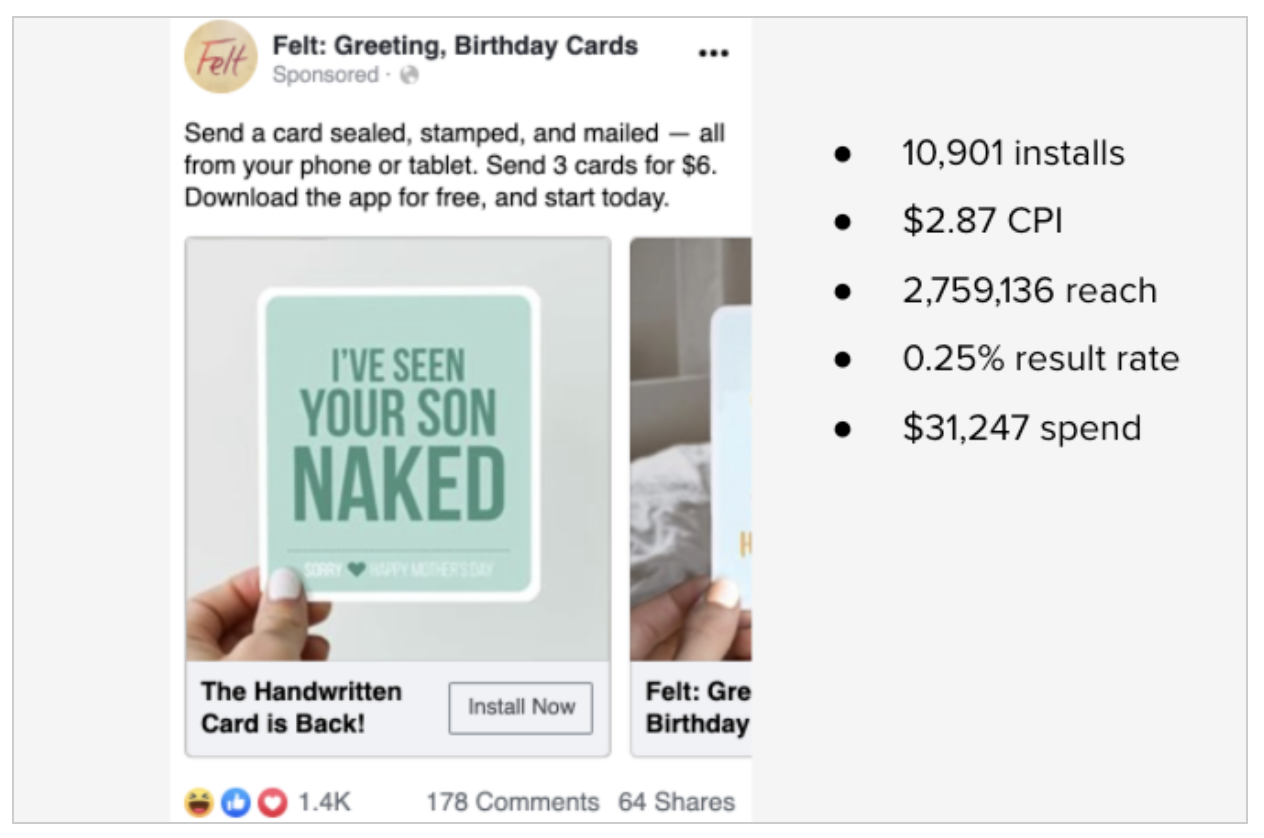
The third best ad was event-specific, and also in the carousel format. It showcased end-products of the app, and also had the clear concise message about what the app does. Because it was event-specific, costs may have been higher, as it wasn’t relevant to everyone who saw it. All this said it was our third best ad of dozens of ad variations run over the 60 day campaign period.
Results
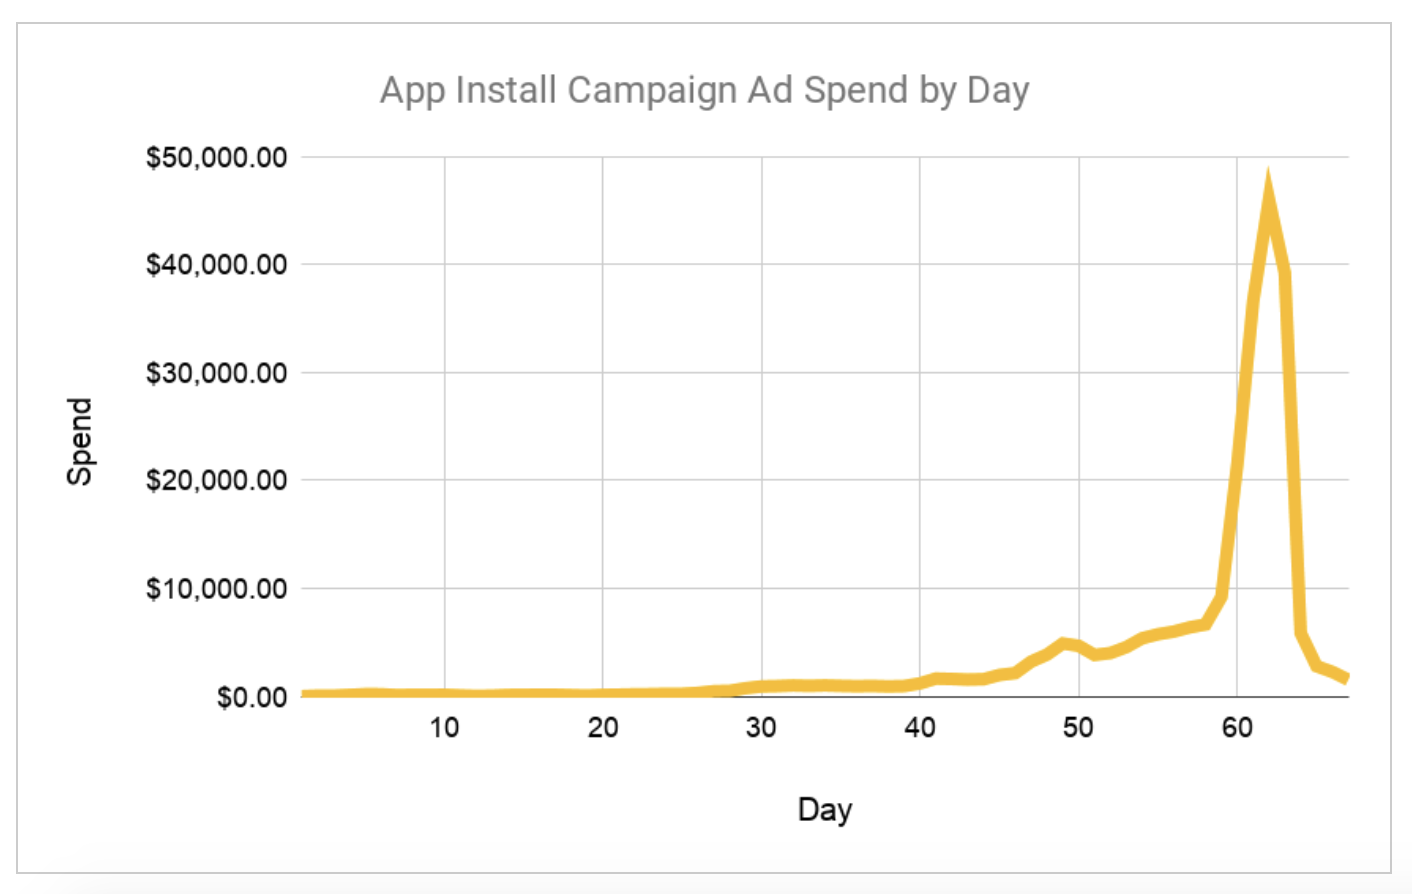
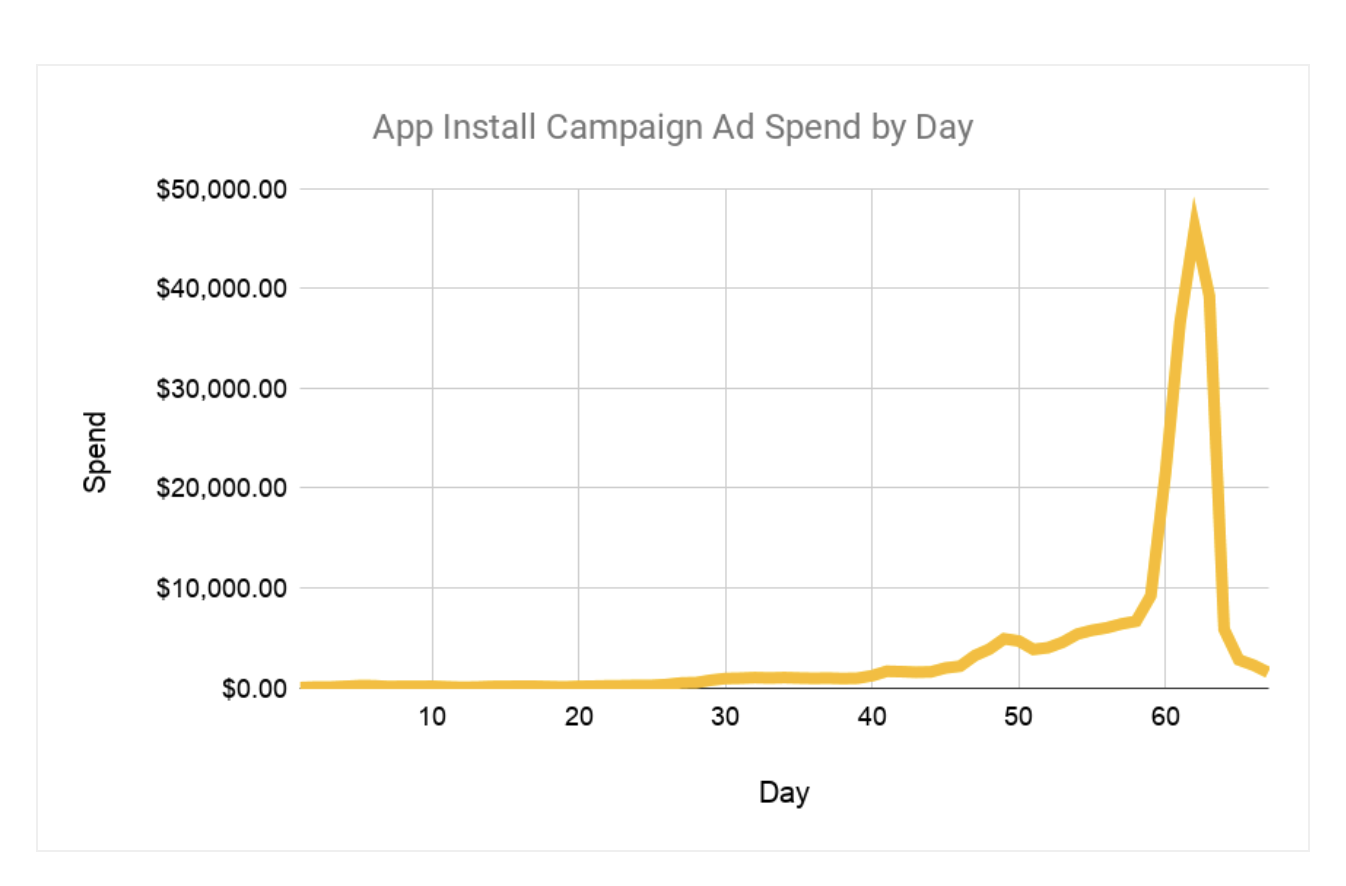
Getting to $45,000/day didn’t happen right away. There was little visible activity in the first 30 days while the hard work of research, audience, and creative testing was executed. Increasing spend was only possible because of this critical foundation established early on.
Spend peaked several days before the event this campaign was based around, after which we settled in at $1,000 – $2,000 / day spend.
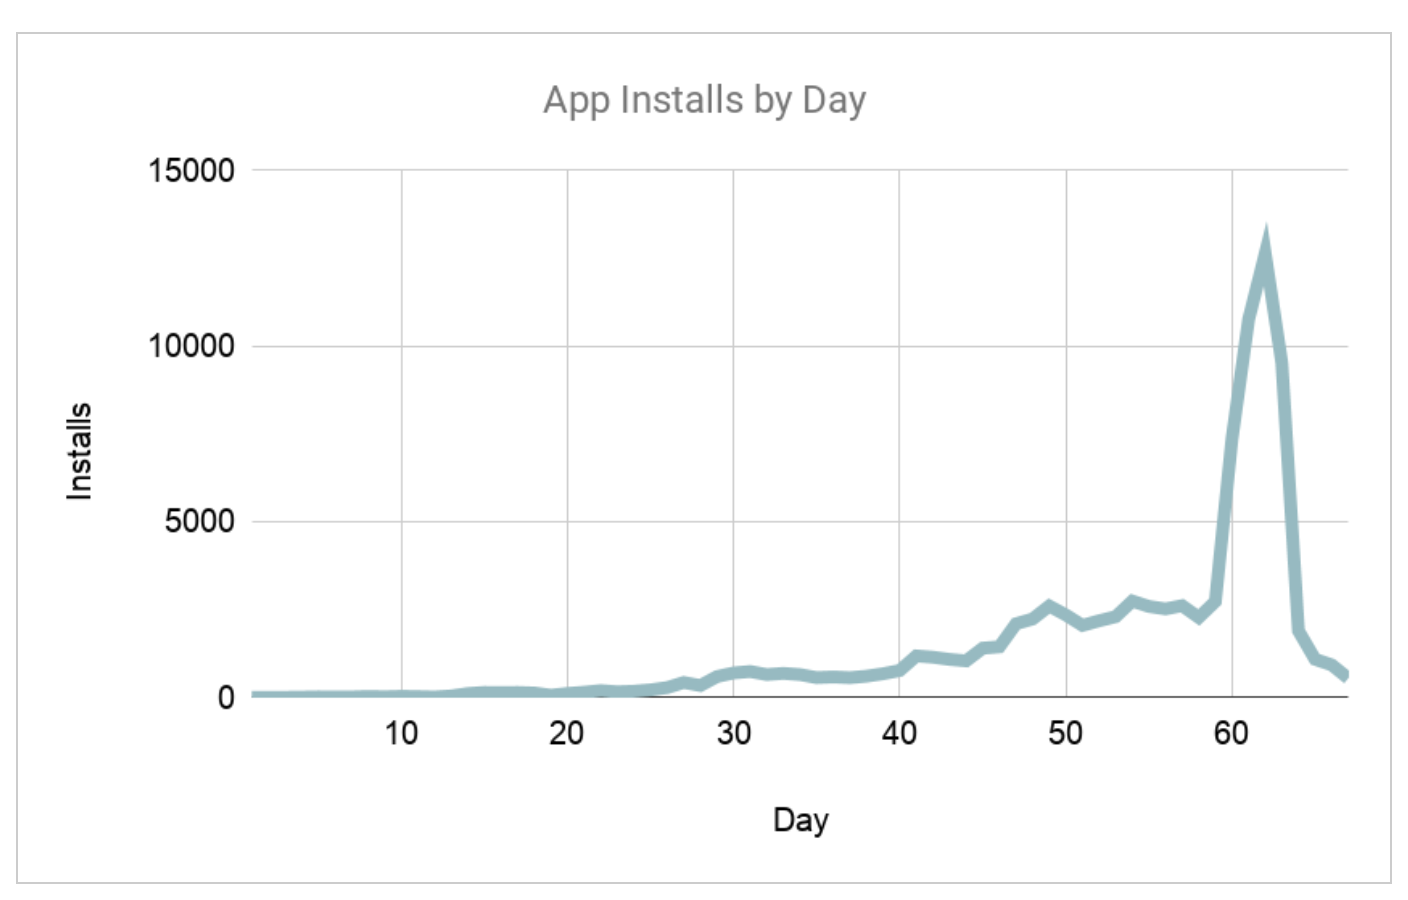
Installs tracked closely with spend. This consistency was the key to our confidence as we pushed budgets up.
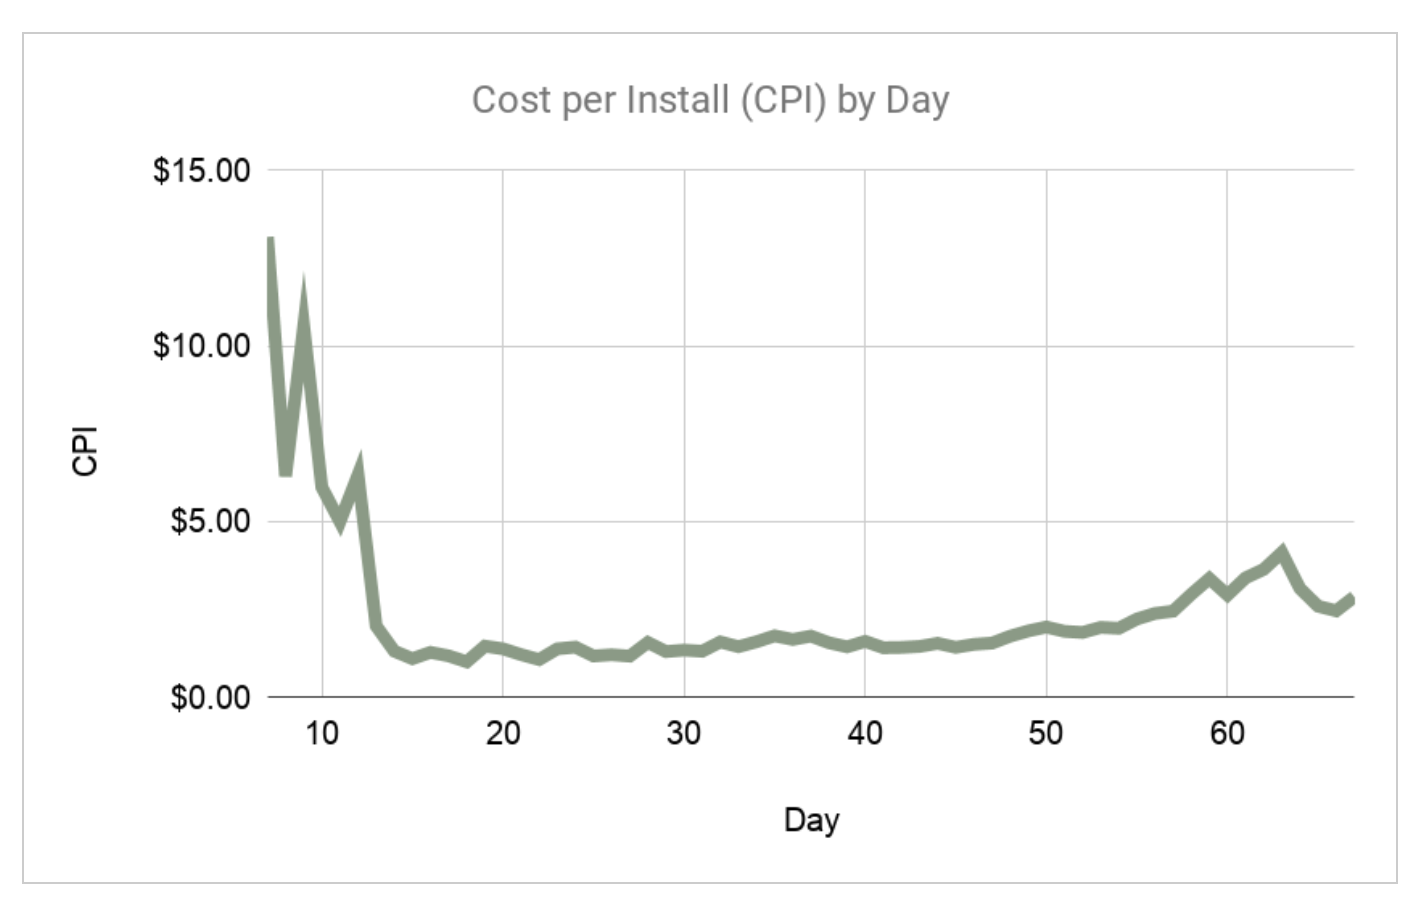
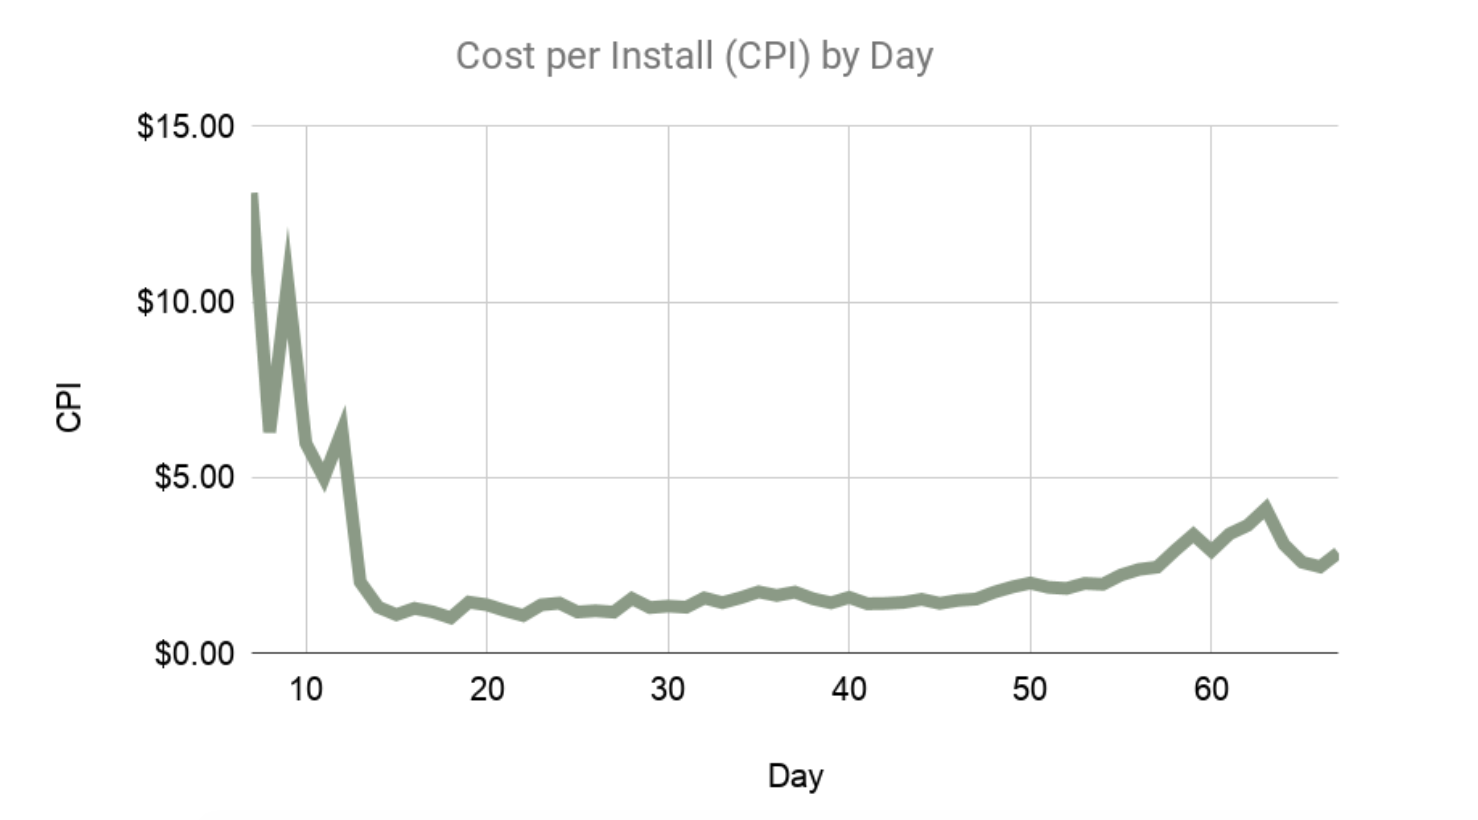
CPI was initially very high. To note the budgets on these learning days was very small. And CPI dropped considerably and stayed low once initial learning was complete.
Key Takeaways to Ramp Up Spend Quickly on Facebook
- Test to identify top audiences, creative and settings
- When an audience fails, try new creative
- Be considerate of technical issues
- Is your site or app capable of the increased traffic from this kind of ramp up?
- Have you requested that the default $5,000/day ad spend cost cap be lifted on your Facebook ad account?
Finally, with these principles in place, don’t be scared to push up ad spend.
Facebook has a propensity to spend what you give it especially with low cost bidding, but this spend isn’t always paired with the desired results. In this case, however, through the approach of finding audiences, creative, and ad settings that would scale, we were able to achieve a massive spend and results ramp up in a 60 day period.

Ellen is the founder at Tuff and one of the team’s core growth marketers. She is a versatile marketer with expertise in multiple channels – from ppc to seo to email to others – responsible for the experiments and testing. She is happiest when she’s on the ski hill or outside pointing her mountain bike downhill.