How to Use Google Analytics to Discover Lookalike Audiences
Do you remember where were you on the day that the digital advertising world stood still? Do you remember what you were doing when iOS14.5 loaded onto scores of devices overnight before their owners even reached onto the nightstand to grab them and open up their social media app of choice? Our growth marketing agency jumped into the brand new world of paid social advertising and have taken away a few key learnings for the post iOS14.5 world.
The Fallout of iOS14.5
On April 26, 2021, Apple followed through on its promise to prioritize privacy with App Tracking Transparency. This update prompted users to either “allow” or “don’t allow” apps on their iOS devices to track their activities.
Paid social advertisers in particular felt the blow like they were brave enough to step into the ring with Mike Tyson in his prime. Much of the targeting that advertisers had become so reliant on was either gone or no longer effective. Despite Apple and Facebook (now Meta) warning for months: so many marketers were drastically affected.
Sure with the change, you could still target Android users, and Facebook did roll out new aggregated events to limit the fallout Some damage control measures went into place, but it goes without question that Apple had delivered a near-fatal blow. So, scrappy Facebook advertisers have had to look for new ways to find their target audience online.
From that scrappiness, new audience targeting strategies emerged that could help social ads strategists and media buyers cut through the crowd and reach their audience. At our growth agency, we’ve identified two lookalike audiences that have proven to be super valuable. Even better, they’re accessible to anyone with Google Analytics installed on their website.
The First Lookalike: Pageviews
The first audience we’ll discuss today is a lookalike audience based on pageviews.
Imagine you’re looking at your analytics and you see that you have 347 transactions this week for a product. For a lot of advertisers, they either stop there or ask the question, “How can I get this number higher?” before they close the tab and move on. Scrappier advertisers take it a step further.
Looking at Google Analytics’ acquisition report we can see the traffic generated from various channels and campaigns.
If you add in a custom segment of Purchasers, you can look at the metrics based on people that have made a purchase on the website. From there we want to know the pages per session.
In the case of this e-commerce company, the Purchasers had a drastically different behavior than the larger pool of all users. And this is where the beauty is.
From the data, we can tell that Purchasers visited 11.47 pages per session. They were more engaged. They clicked around, they viewed a few pages, and they inevitably visited the cart followed by the checkout page.
We can take an educated guess that a cohort of users with that same behavior pattern would be likely to purchase as well. And that’s what we’re betting on for this first lookalike.
So back in Facebook (still not used to Meta), we’ll make our way to the audiences module within the business manager. Here we’ll be creating a custom audience.
To do this follow the following steps:
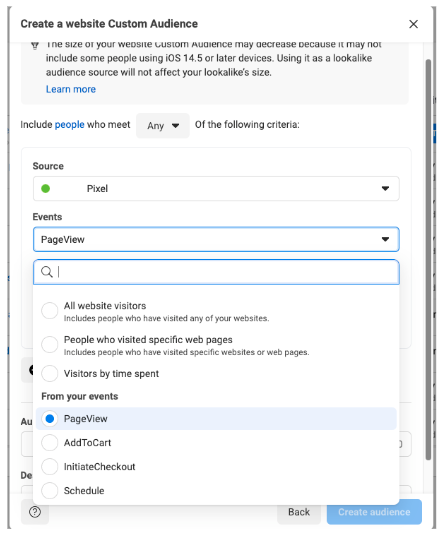
- Choose Website as your custom audience source.
- Choose the pixel you want this based off of
- Instead of selecting all website visitors, select PageView from the events dropdown.
- Click the Refine by dropdown below, and select frequency. We’ll leave the middle drop-down as “is greater than”….
- Change the number to the number of pages per session the Purchasers normally have minus 10-20% (so, if it’s 10 pages, then make it 8). We’re subtracting 2 or 3 because it gives Facebook a buffer so that they can have a large enough audience to build the audience from.
- Click Create audience, and then create a lookalike from that audience.
The Second Lookalike: Time on Site
The second lookalike audience uses analytics as well. Remember that the Purchasers segment spent around 11 minutes on the site. So again, we can safely assume that Purchasers spend more time on the site.
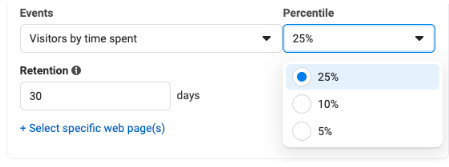
So the second audience we want to create is a lookalike based on time on site. To do this, create a new custom audience. This time instead of choosing PageView from the dropdown of events, we’ll select Visitors by time spent.
For the percentile, start by leaving it at 25%. If the data suggests otherwise in the future, then you could always drop it to 10% or 5%.
Be warned though. As you move to higher percentiles the audience will shrink even more. Once you’ve created this custom audience, go ahead and create a lookalike based on this one too.
The Real Trick to Using Analytics to Build Facebook Audiences
And just like that, you have two audiences based on data that you could target using your first-party data. And this is just the beginning. There is a myriad of different audiences you could build from the data.
You could narrow the custom audience further by switching the parameters from Include people who meet “Any Of” the following criteria to Include people who meet “All Of” the following criteria.
You could create custom events and conversions in your pixel based on events that are important to you and build an audience based on their behavior.
You could select specific web pages to narrow your time-on-site audience.
The possibilities are vast. The important thing is learning how to use analytics to understand your audience beyond the bottom line numbers. From there, you can segment your audience in the way that makes the most sense for your business goals.
Looking to leverage your existing data for your ecommerce site? Our growth agency is happy to dive in and work with you on a growth strategy. Let’s chat!


