How to Use GA4 in 2024: Tips for Marketers

Google Analytics has been a crucial component for countless businesses for the better part of 20 years now. It’s where you can see the traffic coming to your site. You can use this platform to understand the behavior of your customers. What are the most engaging landing pages? What channel are users converting from most often? Is it paid or organic? All of these questions and hundreds more can be answered by simply navigating through Google Analytics.
In just this last year, however, massive changes were deployed to Google Analytics with the official launch of GA4. Things are different now. Virtually everything that was in Universal Analytics has been updated or changed in some way. With this being a much different platform than it used to be, it’s as crucial as ever for businesses and startups to get their footing on this new frontier. We will go through some of our best tips and tricks for how to use GA4 in 2024 and beyond. Let’s strap in!
Introduction to GA4 in 2024
Lots has changed. If you were used to how things were in Universal Analytics then you may be a little bit lost when you get into the new user interface of GA4. Even the important reporting metrics used to track performance are new in many cases. Before we get into all of the powerful benefits GA4 has to offer your startup or scaleup, here are a few of the most important changes when comparing the new to the old:
List of new metrics:
| Metric | Description |
| Engaged Sessions | Replacement for Bounce Rate, any session where a user visits 2+ pages, spends 10+ seconds, or converts counts as an engaged session. |
| Views | Equivalent to a “Page View” event, the number of app screens or web pages your users saw. Repeated views of a single screen or page are counted. |
| Views per User | This could be thought of similarly to the old Pages/Session metric. |
| Average Engagement Time | Average length of time that a user focuses on a browser. Calculated by adding up all engagement times and dividing by # of Active Users. |
| Engagement Rate | The % of Engaged Sessions; Engaged Sessions / Total sessions. |
| Unique User Scrolls | The # of unique users who scrolled down at least 90% of the page. |
| Exits | The # of times the last event of a session occurred on a particular screen/page. |
Reporting Updates
GA4 has revamped reporting almost completely. There are two different areas for reporting. The Reports Tab and the Explore Tab.
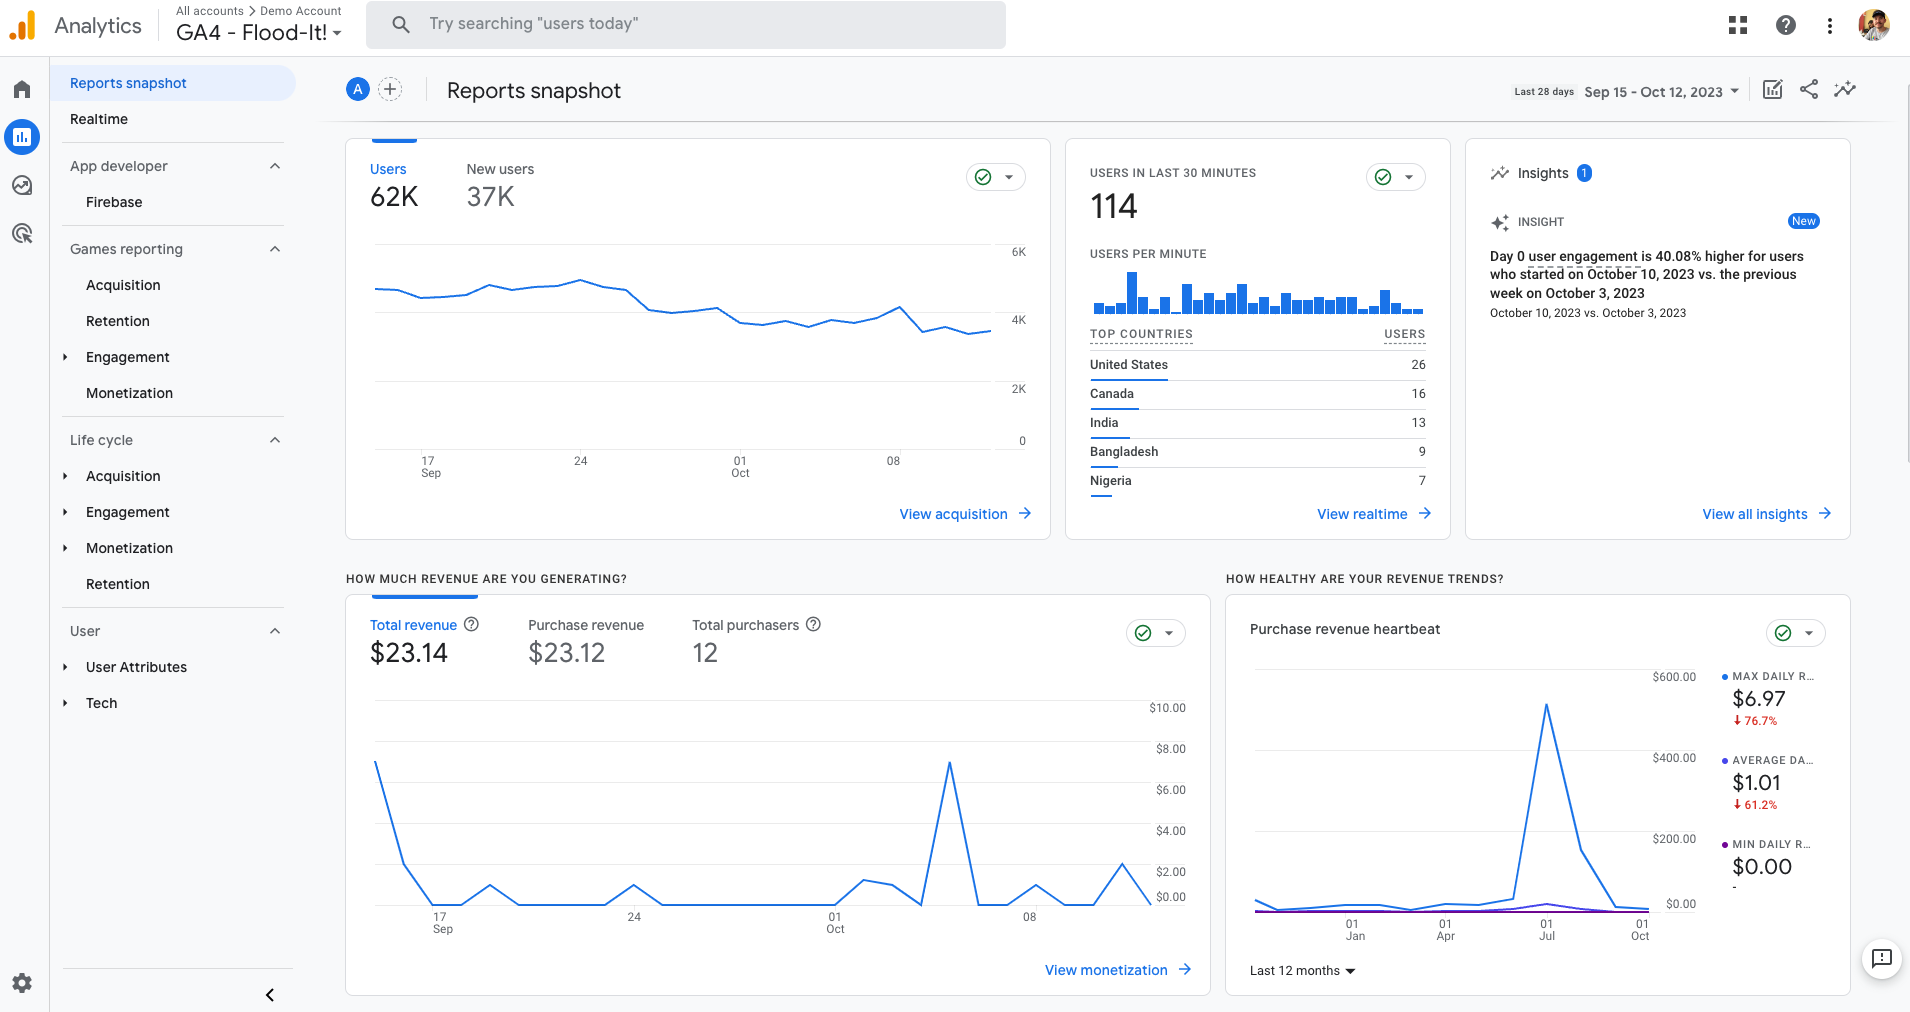
Reports Tab
This tab features much of what was available in Universal Analytics. You can sort through multiple dimensions here including Traffic, Acquisition, Realtime reporting, Events, and Conversions. In GA4, “Events” are the new “Goals” when compared to Universal. Much of the reporting centers around Event Based metrics. This is the tab where a marketer or CEO will spend most of their time. Sort conversion metrics by source/medium or see how much time users are spending on the site with these reports.
Looking at the screenshot below, you can see that one of Google’s priorities in the redesign was ease of access. Everything is organized and fits into movable “widgets” on the new Overview page. Each of these reports is customizable, which we will go into later in this article, but overall, the navigation is improved to make this an easier barrier of entry compared to Universal.
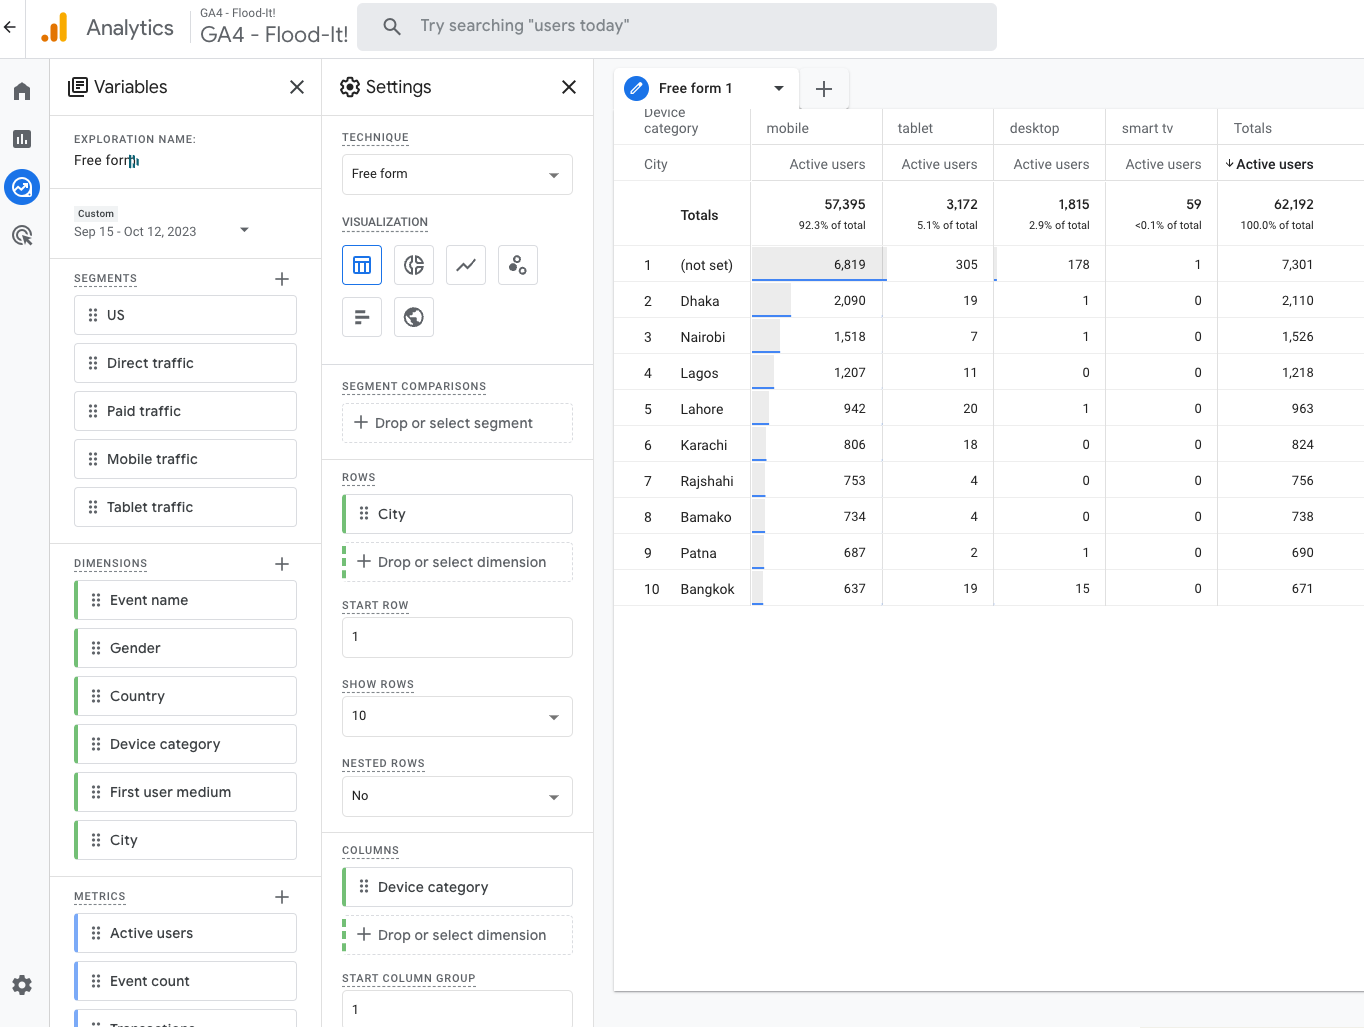
Explore Tab
This is an entirely new area for Analytics, a tab to create custom reports. Now this is not as powerful as Looker or another data visualization tool, but this tab is more effective at slicing data than the standard Reports tab mentioned above. You can create custom Free Form, Funnel, and Lifetime reports to help you analyze user behavior.
This is where filtering comes in handy. If you would like to see the users coming from your Google Ads who converted on a specific conversion event, in let’s say, Chicago, this is the place to do that. This is by no means a perfect reporting option, but we recommend leaning on this to do some of your deeper filtering for data.
Benefits of GA4 for Scaleups
GA4 is streamlined to allow anybody easy access to strong reporting and data, which is especially important for businesses that don’t have a lot of historical information to lean on.
Enhanced Tracking
GA4 leans heavily on configured Events in the new platform. Each account comes with a standard set of events including a Purchase, Button Click, Pageview, and some additional standard page action events. These are just the ones that come with the account. The powerful part of GA4 encompasses creating custom events.
You can create a custom Event or Conversion within the GA4 platform, or with Google Tag Manager. The most common forms of events are Form Submission and Page View events. We like to create a custom Pageview event when a Form directs to a Thank You page, for example. This is a really effective way to track the amount of users turning into a lead for many B2B or B2C brands.
Cross-Platform Integration
Since this is a Google Property you can easily integrate with all other Google properties, but can also track performance from paid social media campaigns, referral traffic, as well as integrate with a CRM like Hubspot. For example, we easily import data from all of these sources below using UTMs or direct integration:
- Google Ads → Possibly the most powerful integration that includes Search, Youtube Ads, Shopping, and Google Display Network. Capitalize on Google Ads performance within the GA4 account to optimize campaigns.
- Firebase → For any App data.
- Social Media → Apply UTMs to social media campaign links to easily pull in Source, Campaign, and Content data for Meta, LinkedIn, TikTok, and Twitter.
- Merchant Center → For eCommerce brands.
- BigQuery → For advanced tracking.
All of these platform integrations can be utilized in reporting throughout GA4. We recommend making custom tabs in the Reporting section for each channel you may want to track and isolate. This can be done using the Library Tool, explained best via Google here.
User Journey Mapping
Understanding the user is one of the most important aspects to any business. Knowing where a user enters, leaves, and converts on your site is key to success. An ideal way to track this involves full funnel tracking. GA4 can help with that, albeit somewhat limited.
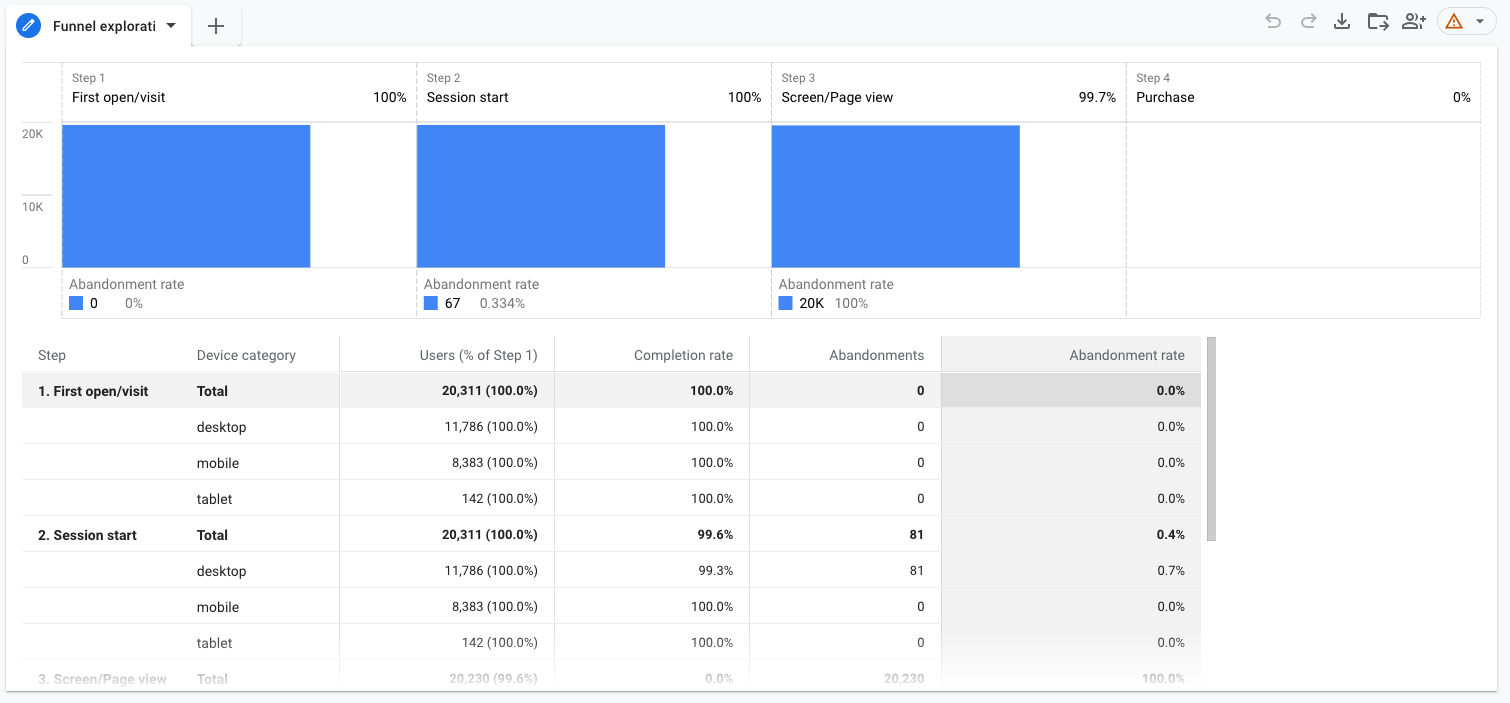
Funnel Exploration
This is where we can start with this analysis. This is a custom report in the Explore tab that allows you to see a User’s Journey. For example, User 1 entered through the Homepage, clicked to 3 more pages, then left an abandoned cart. Each user is different, but patterns start to emerge when data starts to collect around behavior.
For example, if you see that 30% of users abandon the cart after browsing your products, this may prompt the team to look deeper into the checkout process. Why is this happening? How do I identify and fix drop off points in a conversion funnel? Is the flow of checkout quick, or do users have to upload any unnecessary information? All of these questions can find answers starting with the User Journey reports in GA4.
Path Exploration
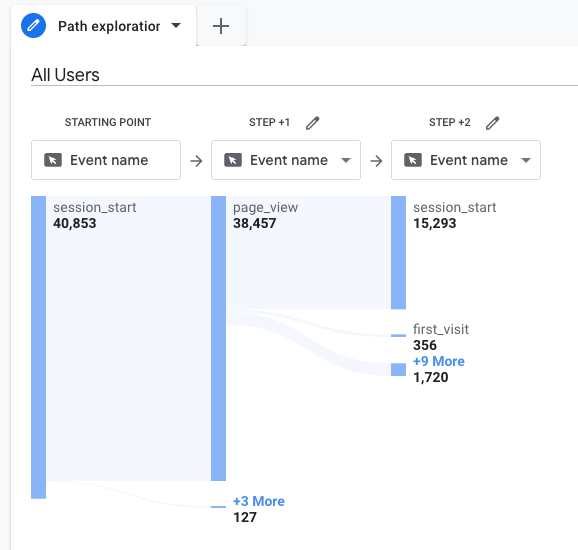
Another powerful reporting option in GA4, the Path Exploration report leans on a tree graph in order to better visualize the user journey. This is where you would want to start if you were used to the visualization in Universal Analytics. It is a very similar report that can be customized and filtered in any way you would like.
We spend a lot of time thinking about conversion rate optimization (CRO) at Tuff. Improving conversion rate on a website by small percentages could translate into quadrupled revenue in the long term. If you find yourself unsure of how to kickstart your CRO initiatives, these GA4 reports can serve as a valuable starting point. Lean on them to help ask your user journey questions and improve from there!
Practical GA4 Implementation Tips
We have learned a lot over the last year while setting up countless GA4 accounts for clients in a wide range of industries. There will always be hiccups when it comes to data and tracking, but our aim here is to make your life a little bit easier so you can worry about one less thing when it comes to growth marketing.
Setting Up GA4
Setup has actually gotten a lot easier since the transition has officially been made from Universal Analytics to GA4. Google uses a “Setup Assistant” to help guide this process. It is broken out into 7 different steps that look like this:
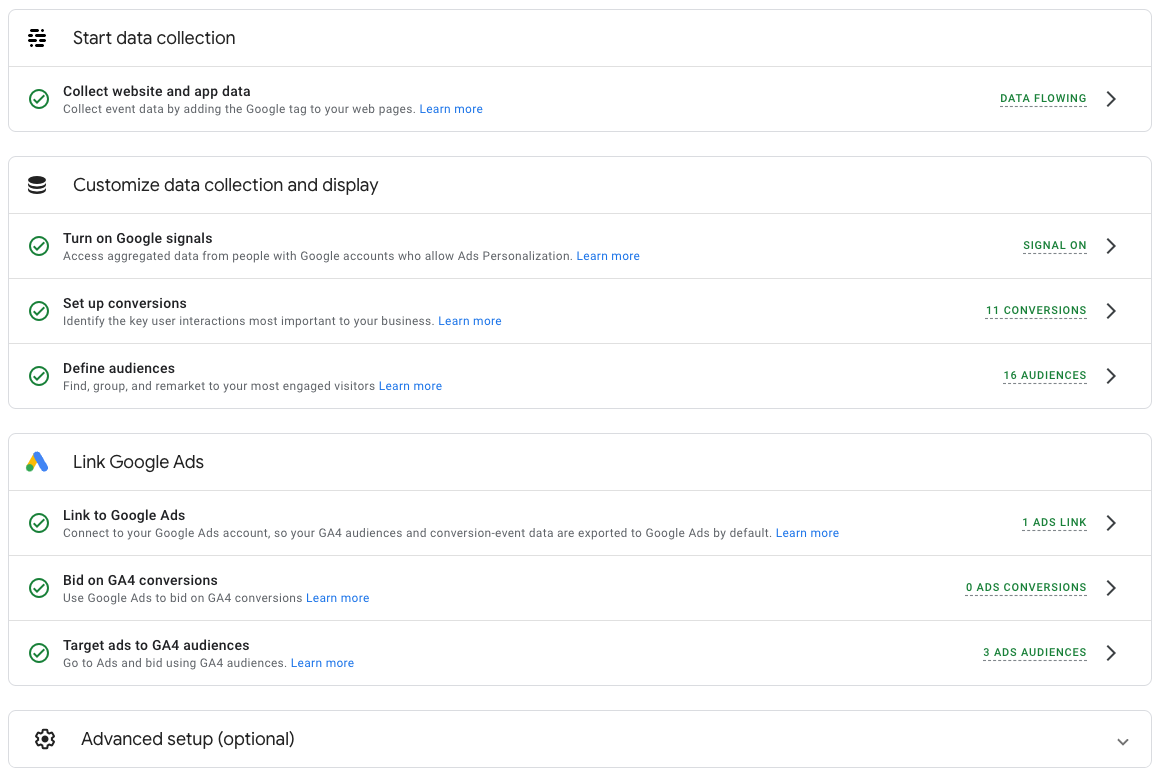
Let’s take a look at the two most important steps in a bit more detail:
- Set Up Conversions → We have talked a lot about events and conversions in this article, and for good reason. Conversions are paramount to your success, and they are different for every business.
- To configure a new conversion in the GA4 platform itself, you have to start with configuring an Event. This can be done with multiple parameters including page_location or event_name. Set your parameters, give it a name, and you will be good to go. You can then check it off as a conversion in the Events tab.
- You can also migrate your conversion from Universal Analytics. This is not a perfect 1 to 1 in many cases, depending on how complicated your conversion setup is, but it can be helpful in the early stages of GA4 setup. (Get more support here!)
- Lean on Google Tag Manager to configure your conversions using the GA4 Events Tag. This can be configured with set parameters, HTML, or a slew of other options. Once configured in GTM, they will automatically populate in GA4 after 24 to 48 hours.
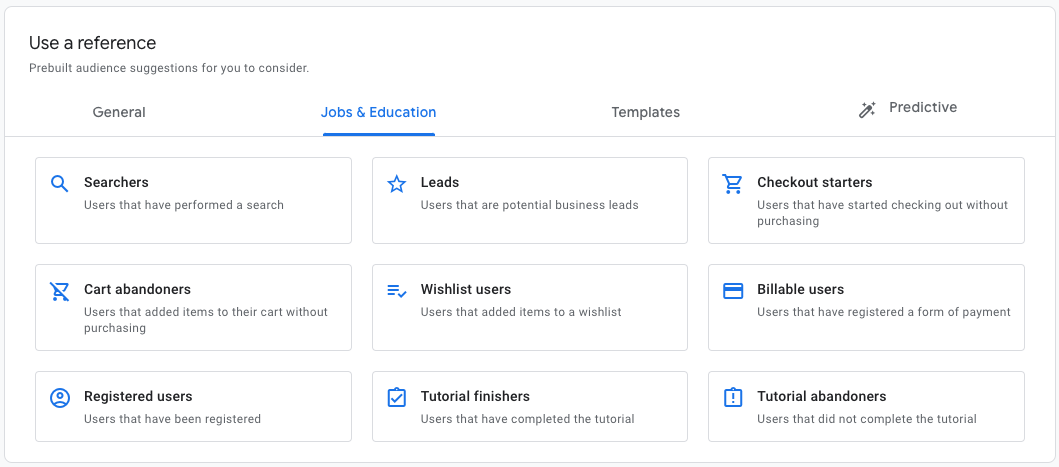
- Define Audiences → This is fairly self explanatory, but defining the target audiences you want to track throughout GA4 goes a long way in helping you make strategic business decisions. These can be custom configured using any parameter you choose, such as users who entered the site via Facebook Ad. You can also use one of these Google templates:
Quick GA4 Tips for All Accounts
GA4 can be overwhelming when you first get in there. SO much of it is brand new with a different layout and overall look. Let’s go through some rapid fire tips and tricks that the Tuff team has been compiling over the last year:
- Data Retention → This is a setting in the Admin section. Default data retention is set to 2 months. We recommend changing that to 14 months. This will allow you to store more data for longer. Never a bad idea in our eyes!
- Reporting Customization → Want to see some of the metrics you were used to in Universal Analytics in your standard reports? Click on the “pencil” icon in the top right of any report. You can then add new columns to your tables for metrics such as Bounce Rate and Average Session Duration.
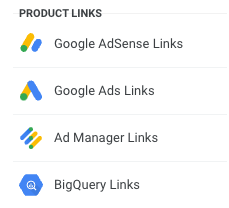
- Link to Other Accounts → Navigate to Admin and link to any account you are currently active on. This is particularly important and valuable for Google Ads accounts:

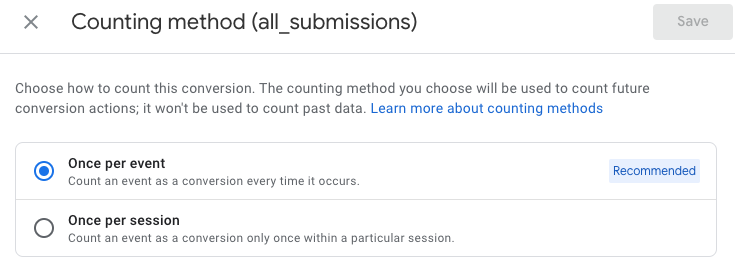
- Change Conversion to Fire Once per Session → This is a tip for anyone who wants to isolate potential double-counting of conversions, mainly those that don’t have a dollar amount associated with them. If you want to make sure a user is only being counted one time when filling out more than one form, turn the Counting Method to Once Per Session for your conversion event.
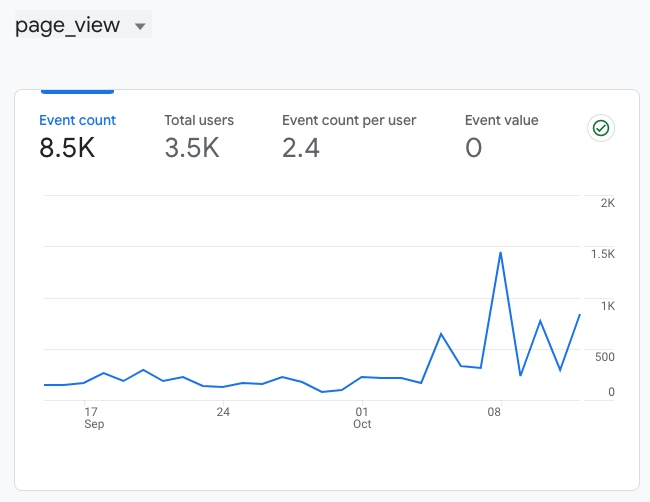
Leveraging GA4’s AI-Powered Insights
One new area of GA4 that comes in handy weekly is the Insights tab. This is powered by AI, which makes it an incredibly powerful tool, especially for those who don’t have the time to sift through raw data. Let’s see what this looks like in practice.
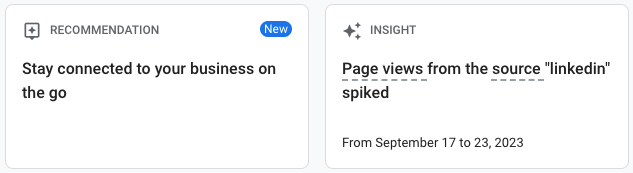
In the screenshot above, we can see that this client had LinkedIn traffic increase during a recent time period. Having quick, digestible insights like this in front of you at all times sends a signal for where you may want to dig in deeper. If LinkedIn traffic spiked this week, that could be indicative of a successful post, mention, or event. Now you know to look further.
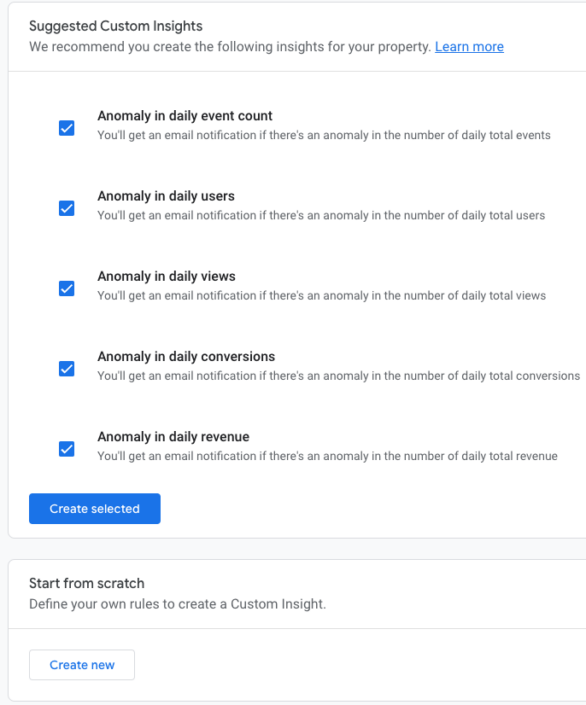
You can even configure your own insights to ping you when certain things happen in the account. Want to always know when you have an abnormally slow sales
day? How about a large increase in page views over a holiday? Well, it’s now easier than ever to have these alerts sent right to your inbox, as well as on the front page of your Reporting Overview.
Navigate to the Insights tab, click Create in the top right hand corner, and there ya go! Set the parameters that work best for YOU. This is a theme of GA4. Tailored to you and your specific needs and goals.
Future-Proofing Your Analytics Strategy
GA4 isn’t just the future – it’s the present and beyond! While it may differ from Universal Analytics and isn’t without its imperfections, embracing its full potential can be an absolute game-changer for your business. Mastering GA4 isn’t just about staying ahead–it’s about securing your growth into the distant future.
Ready to supercharge your business growth? Don’t wait – get in touch with Tuff Growth today or grab a sample proposal here!