The Best Attribution Model for B2C and eCommerce Brands
Attribution is a big topic in the growth marketing world and for good reason. Knowing which channels, campaigns, audiences, and ads hold the most value for your brand’s performance is incredibly important for growth.
The challenge for B2C and eCommerce businesses though is that running multi-channel growth marketing strategies with perfect attribution is incredibly difficult. And even when you get strategic with Google Analytics attribution models, it’s still not always easy to know exactly how each channel is impacting your bottom line.
So what should you do to figure out how to scale?
In this article, I’ll lay out a few different attribution models and look at their pros anc cons, then show you how to analyze conversion paths and use them in tandem with attribution models to (hopefully) give you some deeper insights as to how your channels are doing and where to scale spend.
Channel Platform Attribution
As a growth marketing agency, when we hear about astronomical Return On Ad Spends (ROAS) above 5x and getting up into the 20s, it usually has something to do with Channel Platform Attribution.
Channel Platform Attribution for the uninformed is when you pull performance data from dashboards within the ad platforms you are advertising on. For example, let’s say you’re running Facebook (Meta?) Ads. Within the Facebook Ads Manager, you can see performance metrics that help you understand how your campaigns, ad sets, and ads are performing.
The logic for using this has generally been that it will be the most accurate because it’s the platform you’re using for the actual ads.
The thing to remember is that ad platforms like Facebook make the majority of their revenue through their advertising platforms. Therefore, it’s in their best interest to have the most liberal attribution models, because the more that can be attributed to their platform, the more you’ll spend in that platform, the more that platform will make from you.
Last Click Attribution
The most conservative of all the attribution models, Last Click is the default attribution model within Google Analytics.
As the name suggests, Last Click attributes conversions to the ad / channel that was last clicked prior to the conversion.
Sample Paths
- Direct > Organic > Google Search / Branded > Conversion
- Facebook > Organic > Facebook > Conversion
- Facebook > Conversion
In the sample paths above, which channels will be attributed with conversion in a last-click model?
If you guessed, Google and Facebook for each path, then you are correct.
The problem with this attribution model is that it was developed prior to multi-channel marketing being as dominant as it is in today’s advertising landscape.
Once you get past a 1 touchpoint conversion path, attributing the channel / campaign / ad that was last clicked before a conversion is a bit of a stretch.
Was it the Facebook Ad that was last clicked or was it initially the organic search that led to the session over 5 minutes long where the user dove in on the product and in some ways made up their mind.
Linear Attribution
With last click, it’s hard to tell which touch point is driving the conversion. In a linear attribution model, the entire conversion path is given equal weight showing that the whole path contributed to the conversion.
This inherently reveals that more than one channel contributed to the conversion.
What it fails to get at is which one.
The Perfect Attribution Model (Hint: There’s not one)
There is no one perfect attribution model and it’s unlikely that there will be one for the foreseeable future.
What’s more important than searching for the magic crystal ball that will tell you exactly what platform to put your money into is being able to understand each attribution model and what they’re saying about your strategy. Examining multiple attribution models can give you a better understanding of how your channels are doing than just one individual model.
In addition, it is critical that you understand how each channel / campaign / ad is driving influence for your conversion.
For instance, if you see that on average your path lengths are 2x touchpoints long and a high percentage of them that end in conversion are: organic / search > branded / search > purchase
- What is driving people to search my brand organically?
- Is my website ranking for high intent Keywords important to my business?
- Am I running social campaigns like Youtube or Facebook Ads that are targeting the right audience but resulting in organic searches rather than direct clicks?
Using attribution models to tell you which channel to increase spend in that path length example of organic > branded > purchase will not yield an increase in conversion.
Only when you understand the conversion path will you be able to understand where to scale (you know like Yoda would say).
Analyzing Conversion Paths > Using a Single Attribution Model
One of my favorite tools to use for them is the report in Universal Analytics called “Top Conversion Paths” located in Conversions > Multi-Channel Funnels > Top Conversion Paths.
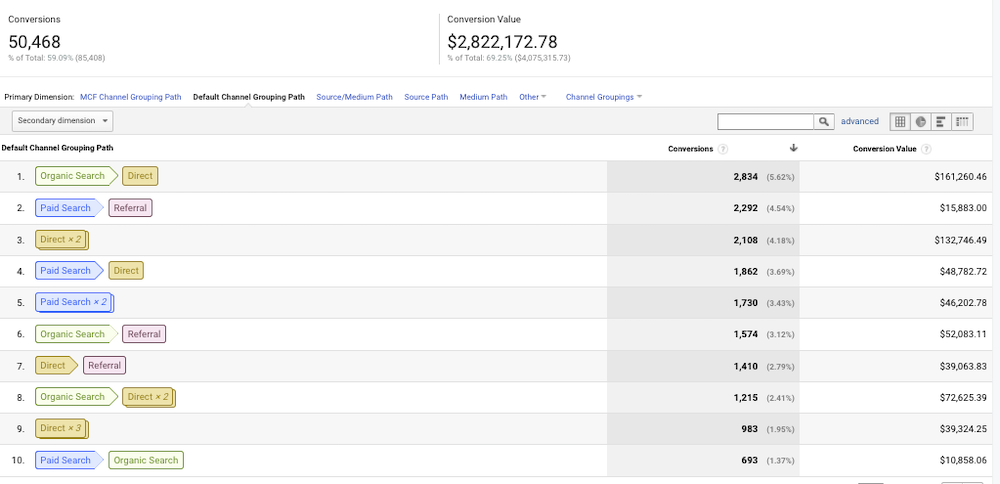
This report defaults to showing path length at the Channel Grouping level, but you can go down to the ad set level.
It’s a great way to see how many touchpoints on average it’s taking for users to convert and which channels are involved in the conversion.
It’s even better when you use insights from the report in tandem with multiple attribution models.
The best way to do this is to manually track your results in a spreadsheet in a Week over week (WoW) cadence.
For each channel that you’re tracking, you’ll want to include multiple attribution models.
For example, your tracking spreadsheet might look like this:
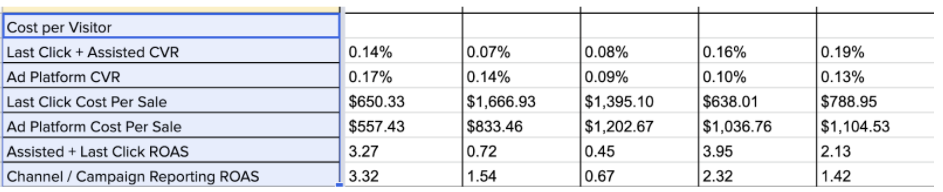
The above is pulling in the marketing spend for all channels, followed by web traffic, then we segment by Last Click + Assisted and Ad Channel Platforms.
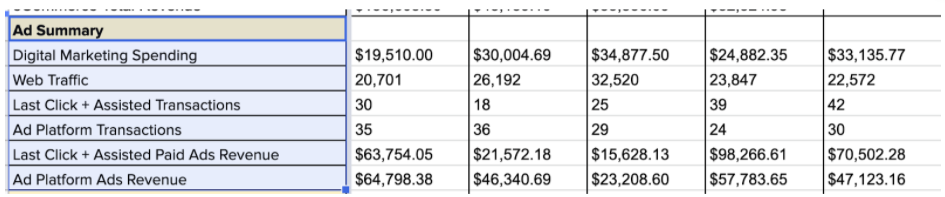
By showing multiple types of attribution models we’re able to drill down on what’s working and what’s not then run comparisons of what’s working against other attribution models.
The result is not a crystal ball look into what’s driving growth, rather it’s an understanding of what channels are contributing most significantly to your overall growth.
When you pair these insights with the Top Conversion Path report in Google Analytics, your insights will be far deeper than with any one attribution model.