So….Is That Good? The Complete Guide to Benchmarking Ad Creative
Does it follow the brand book? Does it speak to the right audience? Does it abide by general design principles? 👈 These are the questions that most designers or agencies ask themselves when they’re answering the question: “so…is that good?”
But, as a creative team nestled within a growth marketing agency, we demand much, much more out of every asset that leaves our desks.
In addition to putting our assets through the typical creative wringer, we put each through a gauntlet stacked with data. That allows us to work in-step with growth marketers and channel experts to design creative that uplifts campaign performance and, ultimately, drives revenue.
Primary Metrics and How We Use Them
Hop into Facebook Business Manager, TikTok Ads Manager, or any of the other back-end dashboards that power your campaigns and you’ll see a wealth of data to parse through. Here are the metrics we hone in on when it comes to benchmarking creative and what they tell us about each asset:
Click-Through Rate: When we see a high CTR on an asset, we can deduce that it was attention-grabbing and compelling enough to drive our audience to click.
Cost Per Click: Similar to CTR, CPC is a metric that helps us understand how “grabby” our creative is. The lower the CPC, the stronger the creative.
Conversion Rate: While we use the platforms’ owned dashboards to peek at CTR and CPC, when it comes to CVR, we’re all about Google Analytics. When we see a higher CVR on a piece of creative, we can deduce that not only was the creative compelling enough to earn us a click, but also the user was equipped with enough information (and excitement!) to complete a desired action once they hit the site. Obviously, the ad creative is only part of this equation (site experience and UX is the other big-hitter when it comes to this metric) but it’s still super helpful in understanding the performance of an asset.
Cost Per Conversion: Similar to CVR this is a metric that helps us understand how actionable our creative is. The lower the cost per conversion, the stronger the creative.
Secondary Metrics and How We Use Them
Just the same as how the DNA of each growth marketing strategy differs, so do the KPIs and useable metrics. So, while the above four metrics are typically the most important, sometimes we don’t have the luxury of leaning on them. Instead, we can use other helpful metrics to fill in the blanks.
Time on Site: TOS is a great substitute for conversion rate and cost per conversion for organizations with higher customer acquisition costs.
Leads: This one is simple – instead of peeking at conversion rates, sometimes lining up the total number of leads or conversions, take a look at the hard numbers.
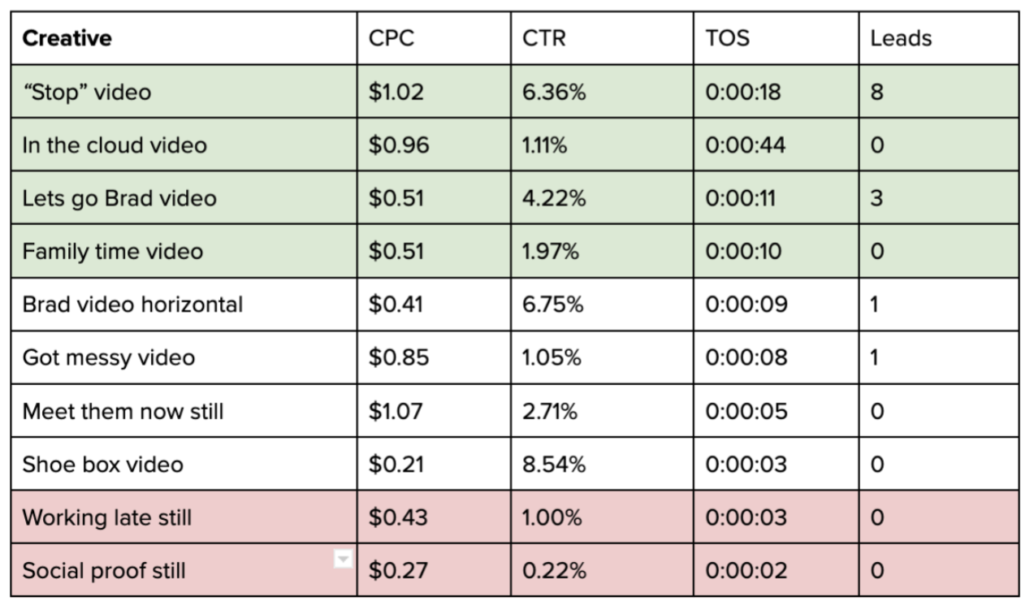
Here an example of how we’ve subbed in other metrics when CTR, CPC, CVR, and CPC can’t tell the whole story:
We work with an organization with a relatively high cost per conversion. That means, with their monthly budget, sometimes we’ll only have one or two conversions on even our best-performing assets. In this case, CVR and CPC are relatively useless metrics (because they’ll only give us information on a few of our assets). To solve for this, we’ve subbed in time on site (TOS) in place of CPC and CVR.
Industry Benchmarks by Platform
Okay, so you’ve compiled your data, you can see which assets are driving stronger performance. But still, is it good? Take a peek at the industry benchmarks by the the most-used platforms to see how your creative measures up. We’re only including click-through rate and cost per click in the chart below because conversion rate, cost per conversion, and time on site depend so heavily on factors outside of the ad platform (like the UX of your site, cost of your product/service, etc):
Facebook (including Instagram):
- CTR: 0.9%
- CPC: $0.97
TikTok:
- CTR: 3% to 12% CTR
- CPC: $1.20
LinkedIn:
- CTR: 0.55%
- CPC: $5.58
Note: these are averages across all industries. There can be significant discrepancy depending on industry, so make sure you dive a little deeper to get the full story!
Leveraging Data to Make Better Creative
Data for data’s sake is simply a waste. So, the most important part of the entire equation is gleaning insights that make a massive impact on what you make next. While leveraging data to untangle what’s working and what’s not is a bit of an exercise in educated interpretation, overtime, it can make a massive difference. Here’s a shortened version of our process here at Tuff:
- Gather the growth marketer, social ads expert, and creative lead ‘round to get a big-picture view of the best performing assets and the ones that were left behind.
- Identify common threads among the top three/four at the top and bottom of the pack. Investigate things like:
- Which value props are featured?
- Are there color/type similarities?
- What type of creative are in these groups? Videos? GIFs?
- What kind of content is featured? Big, bold copy? Testimonials?
- Articulate your high-level insights about what worked, what didn’t work as well, and how you plan to create a fresh round of assets that honors what works and leaves behind what doesn’t.
Think you could use a hand gathering and synthesizing data to make creative that doesn’t just look nice, but drives real results? Let’s talk.

Fresh from the creative world, Elle brings a strong left brain/right brain balance to every new business challenge she meets. Her hunger to learn and unflinching willingness to get her hands dirty combine to make her the person that never runs out of questions. Happen to catch her away from her laptop? She’s likely flecked with dirt kicked up by her mountain bike.


