
Free SEO Report Template

Finding the perfect SEO report template is a challenge. You need to provide enough insights so that anyone looking at the data can understand what the numbers mean.
However, you don’t want to overload your reports with data without providing context. On top of that, your report should reflect your brand, track your SEO progress accurately, and save you time.
At Tuff, we use several tools to track the progress of our SEO efforts, including Google Analytics and Search Console. Then, for some partners, we use Google Data Studio to bring it all together into a dashboard that updates in real-time and includes visuals like charts and graphs.
In this article, we’ll go over how to use Data Studio to create professional SEO reports. We’ve also provided this free SEO report template and we’ll show you how to customize it with your own site’s data.
What is an SEO report?
An SEO report tracks your SEO metrics or key performance indicators (KPIs) and provides an overview of the impact of your organic efforts.
Which SEO metrics should you track in your report?
The SEO metrics you track may vary slightly depending on your brand’s goals and KPIs. But, for the most part, SEO experts track similar metrics to indicate success.
At a minimum, you should be tracking organic:
- Monthly traffic
- Leads
- Revenue
- Conversions and CVR
- Pages per session
- Bounce rate
- Keyword movement
- Top performing pages
At Tuff, we use an SEO metrics spreadsheet similar to this one to track our performance each month.
Although we also use dashboards, a spreadsheet forces us to manually go into Analytics and look at the data every few weeks.
A dashboard helps you visualize your data in charts. Also, because it is connected to your data sources—whether that’s Google Analytics, Search Console, or another platform—it automatically updates in real time.
With a dashboard, you cut down your time spent pulling data manually. However, it shouldn’t be a set it and forget it solution. You should keep track of your data and check in on your campaigns regularly—at least once a week.
What does an SEO report include?
This SEO report dashboard includes organic:
- Traffic sessions
- Leads
- Pages per session
- Session duration
- Bounce rate
- Keyword performance
Because it is a Data Studio Dashboard, you can customize the data to fit your needs. For example, we created filters to view non-branded keyword traffic.
What does a good SEO report look like?
Usually, an SEO report will track metrics like your monthly organic traffic and conversions. However, because SEO is a long-term investment, you should also be able to view your progress over several months to a year.
It should have a combination of quantity (organic traffic increases) and quality metrics (session duration, bounce rate, leads, and conversions).
I also recommend including a summary page that includes the most important insights that you pulled from the data.
For example, if your organic traffic tripled in the last month, you should identify why. It could be that you refreshed several pages and they now rank at the top of the search results. However, it could also be that your site got hit with bot traffic.
Providing that high-level insight distinguishes experts from everyone else. It also provides you with learnings about your strategy, so you can identify what is working and eliminate what isn’t. If you see that one page gets a lot of traffic and has high session duration and organic conversions, maybe there is something on that page you can apply to others across your site.
How to Use the SEO Report Template
You don’t need to be an expert in Data Studio to copy this SEO report template and use it. However, you will need access to Google Search Console and Analytics and basic to intermediate knowledge of how to use them. You should also have an understanding of what goals and segments you have set up in Analytics.
First, go to the SEO Report template here, go to “File”, and click “Make a copy”. Alternatively, you can click the three dots in the corner and select “Make a copy” from the drop-down.
A box like the one below will appear. You’ll need to be signed into the Google account with access to your analytics data.
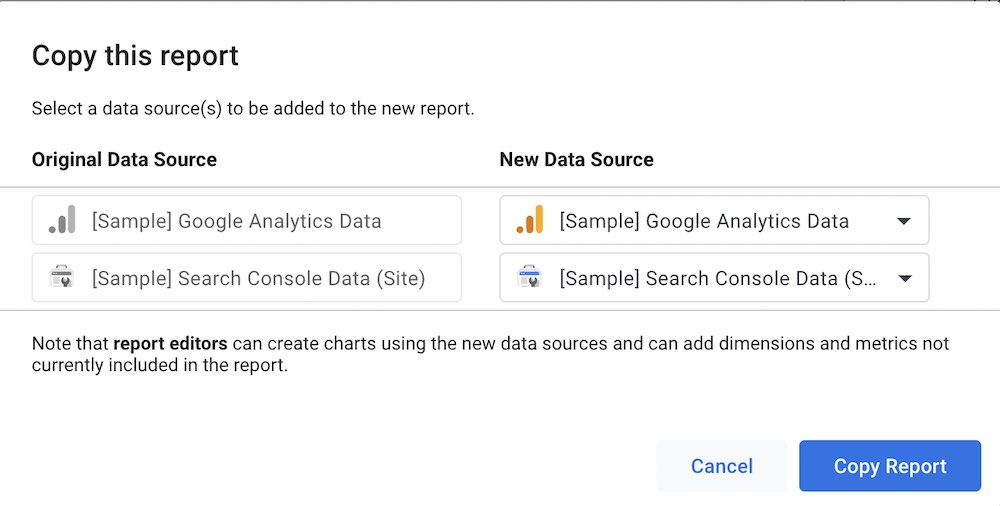
Go to “New Data Source” and choose where you want to pull data from—Analytics and Search Console—then hit “Copy Report”.
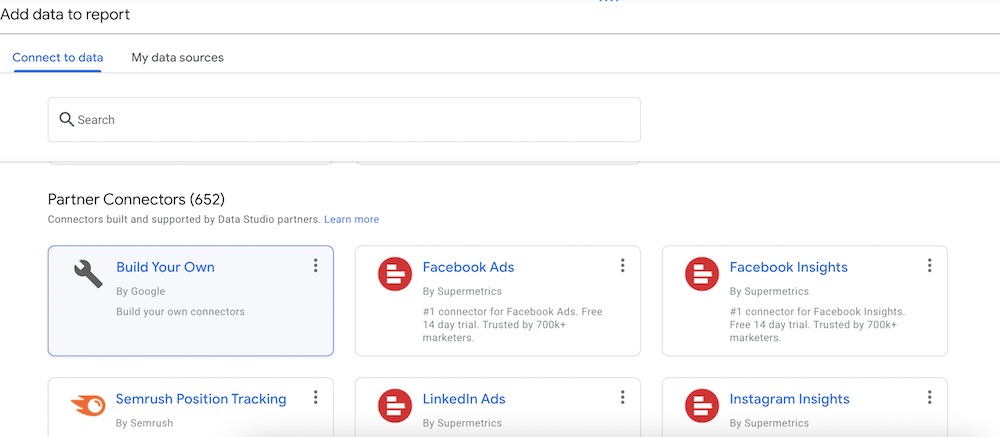
You can also pull from other sources once you are inside the template by going to the Data tab on the right. Then, click on “Add Data” at the bottom.
It will show a popup with options to connect from Google products or to build your own. With this, you can pull in data from social channels or SEO tools like Semrush. For SEO, you likely won’t need social, but Semrush may be useful. However, keep in mind that the more data you add, the more complicated it can get.
Our Dashboards often blend data sources from Analytics and Search Console. Blending is more advanced, so we’re not going to cover it for this template.
Once you have your data sources, you can begin editing and customizing the SEO report template.
Keep in mind that this example may look different. It is because we are using Google’s sample data rather than revealing website data.
Before we dive into the report pages, you’ll need to know how to customize them with your site metrics and branding.
How to Edit Charts
To edit any of these, you simply click on them. A Chart tab will appear next to the Data tab. Underneath it, there are two options—Setup and Style.
To configure the data that is used, you’ll choose “Setup”. To customize the look and appearance, for example, to change the bar chart colors, you’ll go to “Style”.
Inside the “Setup” tab, you’ll need to know these configurations:
- Data Source – This is the data that appears in the chart you select. To update it, choose your Google Analytics as the data source.
- Dimension – We set this to show month and year. For reporting purposes, you’ll probably want to leave this as it is.
- Metric – This is the metric that appears in the bar chart, and in this case, it’s sessions. You can change this by going to the Metrics section and clicking “Add metric”.
- Default date range – You can customize the time frame that appears on the horizontal axis. It is preset for you with a yearly range, but you can adjust it with custom dates.
- Filter – This section is a must. You need to have a filter in your analytics that is organic search only. Otherwise, you’ll be pulling in all website traffic from all sources, not just organic.
For the most part, you’ll leave the other settings as they are in the template. Once you know how to edit the charts and update them with your site data, it’s pretty simple.
Cover Page
You can customize the cover page to match your branding by either inserting an image or editing it inside Data Studio. If you do the latter, click on the elements and background to edit. You can change the color of the background, adjust the font, and add your logo.
Also, you can go to “Insert” and “New Page” if you want to add a summary page or add other pages to this template.
Organic Traffic Overview
The second page—organic traffic overview—is one of the most important in the report. It includes the key metrics in cards at the top.
- Sessions
- Users
- New users
- Pages per session
- Average session duration
- Bounce rate
It also automatically updates with the percent increase or decrease from the previous reporting period.
With this template, you can choose to filter by country and date as well with the boxes at the top.
In the middle of the page is a bar chart that shows organic sessions for each month. Remember that we are using sample data, so it will show “No Data” until you update the template with your data sources.
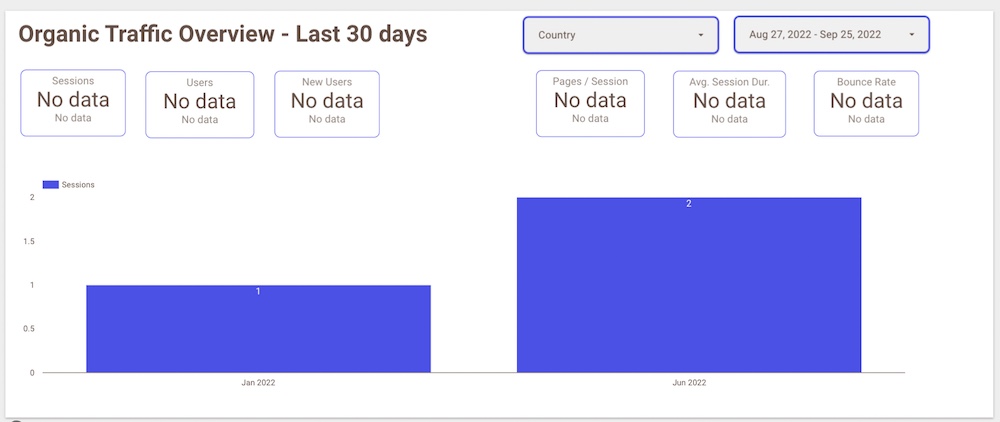
When you pull your site’s actual data, it should update to include your organic traffic for each month. You can also choose to change the metric that appears in the bar chart from Sessions to New Users or another metric by updating that in the “Setup” tab.
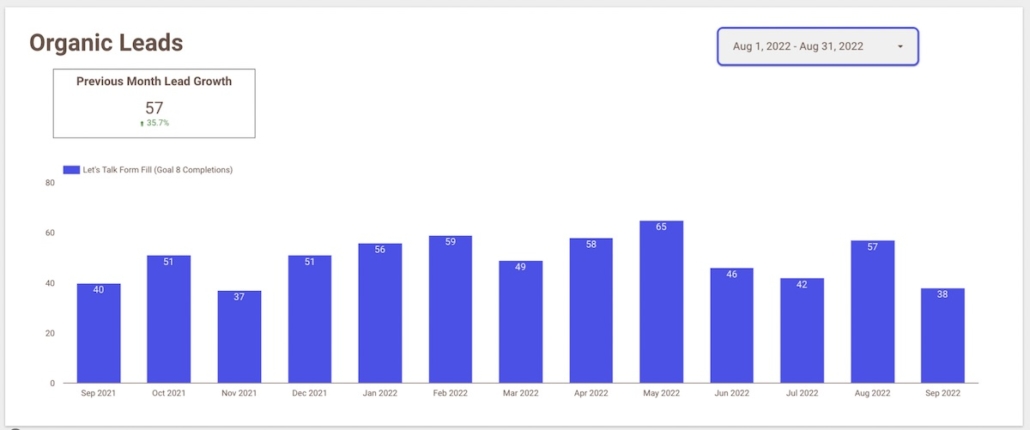
Organic Leads
On this page, you can track how many leads you’ve gotten from your organic efforts. However, you need to have your goals set up in Google Analytics first.
The chart on this page is blank in the report because it’s pulled from sample data. You have to update it by going to “Metrics” and choosing the goal you are measuring from the “Goal Conversions” list.
Then, it will update with a bar chart measuring your leads. It should look like the below chart of example data.
Top Performing Pages – Organic
The first few pages pull data from Google Analytics, now we’ll be pulling from Google Search Console.
Again, because this is pulling data from the Google sample set, it will look different from the report that you generate.
Mainly, this one is using “Query”, but you’ll be using “Landing Page” instead. The sample data doesn’t include URLs or landing pages, so it is not there.
For example, Tuff’s report looks like this:
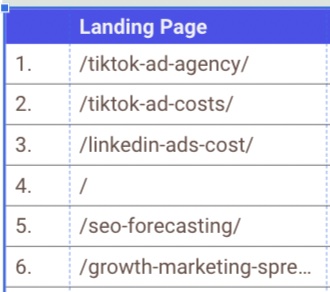
The table also includes:
- Impressions
- Clicks
- Click-through-rate (CTR)
- Average position
- Percent decrease or increase for each
Optionally, you can use the next page, which has the same metrics but also includes a heatmap and ranks the top pages by clicks, CTR, and impressions.
Keyword Performance (MoM)
One of the most important metrics for tracking SEO progress is keyword movement. You need to know what keywords you are ranking for as well as your past and current position.
In other words, you need to know where you started to see how far you’ve come.
For example, let’s say you identify a target keyword and you’re currently ranking in position 12. You want to refresh that page to increase your ranking and get to page one, even better, in the top three results.
As we know, the top position gets the most clicks. The number of clicks goes down as your position falls, so you get more site traffic when you are higher on the results page. Plus, you need to be on the first page to get any meaningful traffic these days. Only .63% of people go to the second page of Google.
But, you need to track your keyword rankings to know if the changes you make have an impact or not. This is where the Keyword Performance (MoM) page of the SEO report template comes in. It tracks your keyword rankings over time.
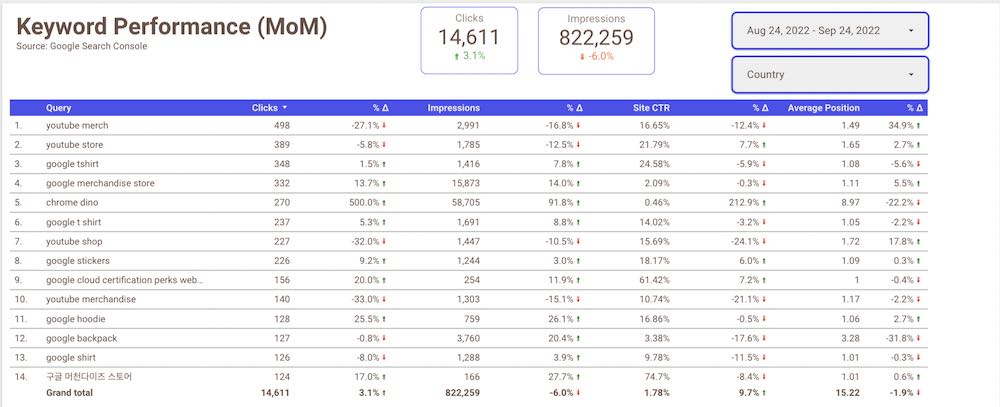
You pull data from Google Search Console and use “Query” as the metric. Again, similar to the top-performing pages slide, you can view clicks, impressions, CTR, and average position. However, you are doing it by keyword rather than landing page.
You can also track clicks and impressions month-over-month and filter by country and date.
This is helpful to monitor when you lose key positions too. When you see a drop, you can react faster to regain top positions and any traffic you lose in the process.
Non-Branded Keyword Performance (MoM)
As you can guess, this slide tracks the same metrics as keyword performance. However, we’ve set up a filter to only track non-branded terms.
SEO often focuses on increasing search visibility for non-branded terms—those keywords that do not include your brand name. Although, this varies. For example, if you are creating comparison content you might want to also track branded, which is why we have the option for both. An example of this is if you optimize for keywords that include [your brand name] + vs + [your competitor].
To set up a non-branded filter, you go to “Filter” in the “Setup” chart tab. Then, “Add a filter” that excludes your brand name.
You can use this as a monthly SEO report template or as a dashboard. Since it is connected to the data sources you use, it will update automatically.
Although using Data Studio for your SEO reports can increase efficiency, you should still set aside time to assess the data and pull insights and learnings. If you are working with an SEO agency, they should provide you with those high-level insights that help strengthen your SEO strategy and organic growth.