2024
Ad Creative Trends Report
Creative Testing Frameworks and Insights from 50+ Ad Accounts to Help You Achieve Your Best Media Results in 2024
![]()
Creative Testing Frameworks and Insights from 50+ Ad Accounts to Help You Achieve Your Best Media Results in 2024
![]()
In today’s competitive landscape, winning the ad game requires being the best at creative. It’s one of the primary levers brands can pull to gain a competitive edge.
We’ve been right where you are, working closely with hundreds of marketers and executives. Together, we’ve fine-tuned a creative testing process that boosts your success rate, helps you learn more quickly, and drives steady ROI.
Our guide will help you master the strategies and tactics that separate successful companies from the rest.
Here’s what’s included:
You wouldn’t throw your money at media without tracking it against specific KPIs and targets, right? Well, the same principle applies to your ad creative. That’s precisely why we created our creative ROI calculator. It’s designed to help brands determine whether diving into creative testing is a worthwhile investment, and if so, what kind of impact it could have on their revenue.
Tuff’s ROI calculator for performance creative is a powerful tool we use to evaluate how well your creative performs within specific ad campaigns. It provides insights into the effectiveness of your creative in generating revenue and offers a glimpse into the potential improvements that could be made.

This calculator takes into account not only your media spend costs and the revenue it generates, but also factors in your current creative performance. It helps businesses decide whether making an investment in creative testing is a smart move. It’s a decision-making tool that can help you optimize your resources for the best possible ROI.
Performance Creative ROI Calculator Template
Now, let’s dive into an example to illustrate how this all comes together.
We analyzed over 50 ad accounts on Meta and TikTok to understand which types of creative drive the most efficient results. At Tuff, we’re performance-driven, so most campaigns in our data set were optimized for a conversion of some kind.
Because costs per conversion drastically differ from one industry to another, our guiding KPI for the insights by channel below is click-through rate. On average, the CTR on Meta hovered at 0.92% between all ad accounts analyzed, compared to TikTok, which averaged a 0.61% CTR.
We also know how the algorithm and level of spend impact these metrics. When you launch a batch of assets, one or two naturally outperform the rest and have the highest CTR / lowest CPA in the early phases of launching. Naturally, we turn off the lowest-performing ads to make sure the budget is allocated toward the winning creatives. As you scale and spend more, it’s normal for costs to increase and CTR to decrease. Knowing this is a common pattern, we’ve removed assets with low-volume clicks from the dataset.
For the insights below, we analyzed the top three ads and the bottom three ads in over 50 ad accounts. We lean on a metric we’ll be referring to as “CTR Delta.” Essentially, we took the CTR of a top-performing or bottom-performing asset and calculated the percent change compared to the account average. Here’s an example:
Top Performing Asset 1 CTR: 11%
Account Average CTR: 3%
CTR Delta: 2.66x
The higher the CTR Delta, the more impactful that particular asset was to performance.
We know video is a top-performing asset type, but it’s resource-heavy and time-consuming to create. Many brands tend to opt for easier-to-execute static assets, but the data tells us investing in video assets yields a higher return. In fact, top-performing video assets saw a 3x higher CTR compared to the account average.
Video Length
The videos in our data set ranged from five seconds to 55 seconds in length. When analyzing CTR, videos under 30 seconds consistently yielded stronger click-through rates in almost every ad account. 20 seconds seems to be the sweet spot. We found that videos 20 seconds in length saw a nearly 14x higher CTR than the account average.
Video Theme
We identified five major production themes in our data set: animated illustrations, animated UX of our clients’ product, animation paired with stock footage, UGC, and brand video footage with animated text.

We’re big fans of value props here at Tuff. For the uninitiated, value props tell potential customers why they should do business with your brand instead of a competitor. They also make the benefits of your product or service crystal clear from the get-go.
For this example, we grouped our main value prop themes into eight buckets. These value props came to life through text and/or voiceover on the actual video asset. We analyzed captions separately for this report.
Resoundingly, benefits-focused messages saw the most efficient CTRs, followed by assets that instilled a sense of urgency and assets that tied back into a seasonal campaign.
Geo-specific assets were among the worst-performing assets. This aligns with what we see in targeting as well. Most of the top-performing campaigns on Meta are very broad and lack geo-targeting. This learning applies to creative, too. Creative that exudes an idyllic lifestyle doesn’t move the needle in the same way that it once did. As social media has become ingrained in our culture, we as a society have become more skeptical of brands that over-promise. The click-through rate data we analyzed speaks to that trend.
In our research, we found that captions that speak to how easy the product or service is to use and captions that highlight a customer testimonial consistently yielded the highest CTRs.

We wanted to see how messaging trends have changed across industries. At Tuff, we work with a variety of companies across many sectors. To draw meaningful insights, we excluded industries where we work with fewer than three clients. The graphic illustrates value prop patterns in healthcare, B2B SaaS, edtech, fintech, ecomm, and DTC SaaS brands.

In today’s world of advertising, brands must make the most of their resources. With soaring media costs, an abundance of platforms, and fierce competition, random ad testing just isn’t a viable option anymore.
Successful brands recognize the need to get it right from the get-go by implementing a strategic approach to creative testing. This approach doesn’t just increase your chances of success. It also enhances the quality of insights gained and leads to a more consistent return on investment.
Here at Tuff, we’ve taken this challenge head-on. We’ve established an in-house performance creative team that has collaborated with hundreds of brands to craft winning creative solutions that make the most of their budget.

We’ve fine-tuned, iterated, and developed a robust five-part framework that consistently yields positive results. This framework ensures that creative content is held accountable to data, using it as a catalyst to enhance your media performance. We’re here to help you navigate the ever-evolving landscape of advertising effectively and efficiently.
Let’s walk you through how this process unfolds:
Let’s kick things off with our first step: a deep dive into your historical creative performance. Here’s a recent ad creative analysis we did for a client running an online coding bootcamp as an example.
The real trick here is to grab data straight from each platform and align it with your specific media spend objectives. If you’re aiming to boost awareness, you’ll want to measure against CPM and frequency. For engagement-focused goals, CTR and CPCs are your go-to indicators. And if conversions are your goal, you’ll want to examine the creative in the context of conversions and CPA. It’s also crucial to factor in your target audience and the allocated budget for each purpose. Are you reaching out to new prospects, or is this part of ongoing campaigns?
Our creative analysis template streamlines the process, allowing us to swiftly collect and analyze large volumes of data at once. From there, our media and creative teams work hand in hand to filter and unearth valuable insights. We ask questions like:
With these insights in hand, we’ll seamlessly transition to the ad production phase, ensuring that we make the most of the data and media campaign learnings. It’s all about using what we’ve discovered to take your ad creative to the next level.
Once we’ve got data to guide us toward winning ad concepts, our next step is crafting a message testing framework. We move quickly to create assets that confirm the most effective value propositions.
Let’s take a look at how this played out for one of our clients who specializes in online eyewear sales. Here’s an example of their message testing framework.
With this framework in hand, we can construct a messaging strategy that not only sets your product apart in the market but also highlights your distinctive value proposition. It’s all about making your message clear, compelling, and utterly scroll-stopping.
With solid data and a well-crafted messaging strategy as our foundation, our creative team starts on production. Our performance creative pods (composed of a creative strategist, copywriters, graphic designers, and animators) team up to design impactful creative assets that both embody your brand and strike a chord with your specific audience and platform.
Here’s a glimpse of our creative process in action, showcased through an ad creative brief and the final assets we created for one of our clients. They offer a product that lets you create group videos at scale.
Crucially, these concepts remain true to our consistent messaging, but we also tailor them visually to suit each platform perfectly. It’s all about keeping your message in sync while making sure it shines on every channel.
Once our creative team has put the finishing touches on the assets, we’ll get down to the nitty-gritty work of resizing and packaging them. These polished creatives will then be handed over to our media team. Our goal? To maximize exposure across various placements and ensure that your creative is primed and ready to deliver the best return on investment possible.
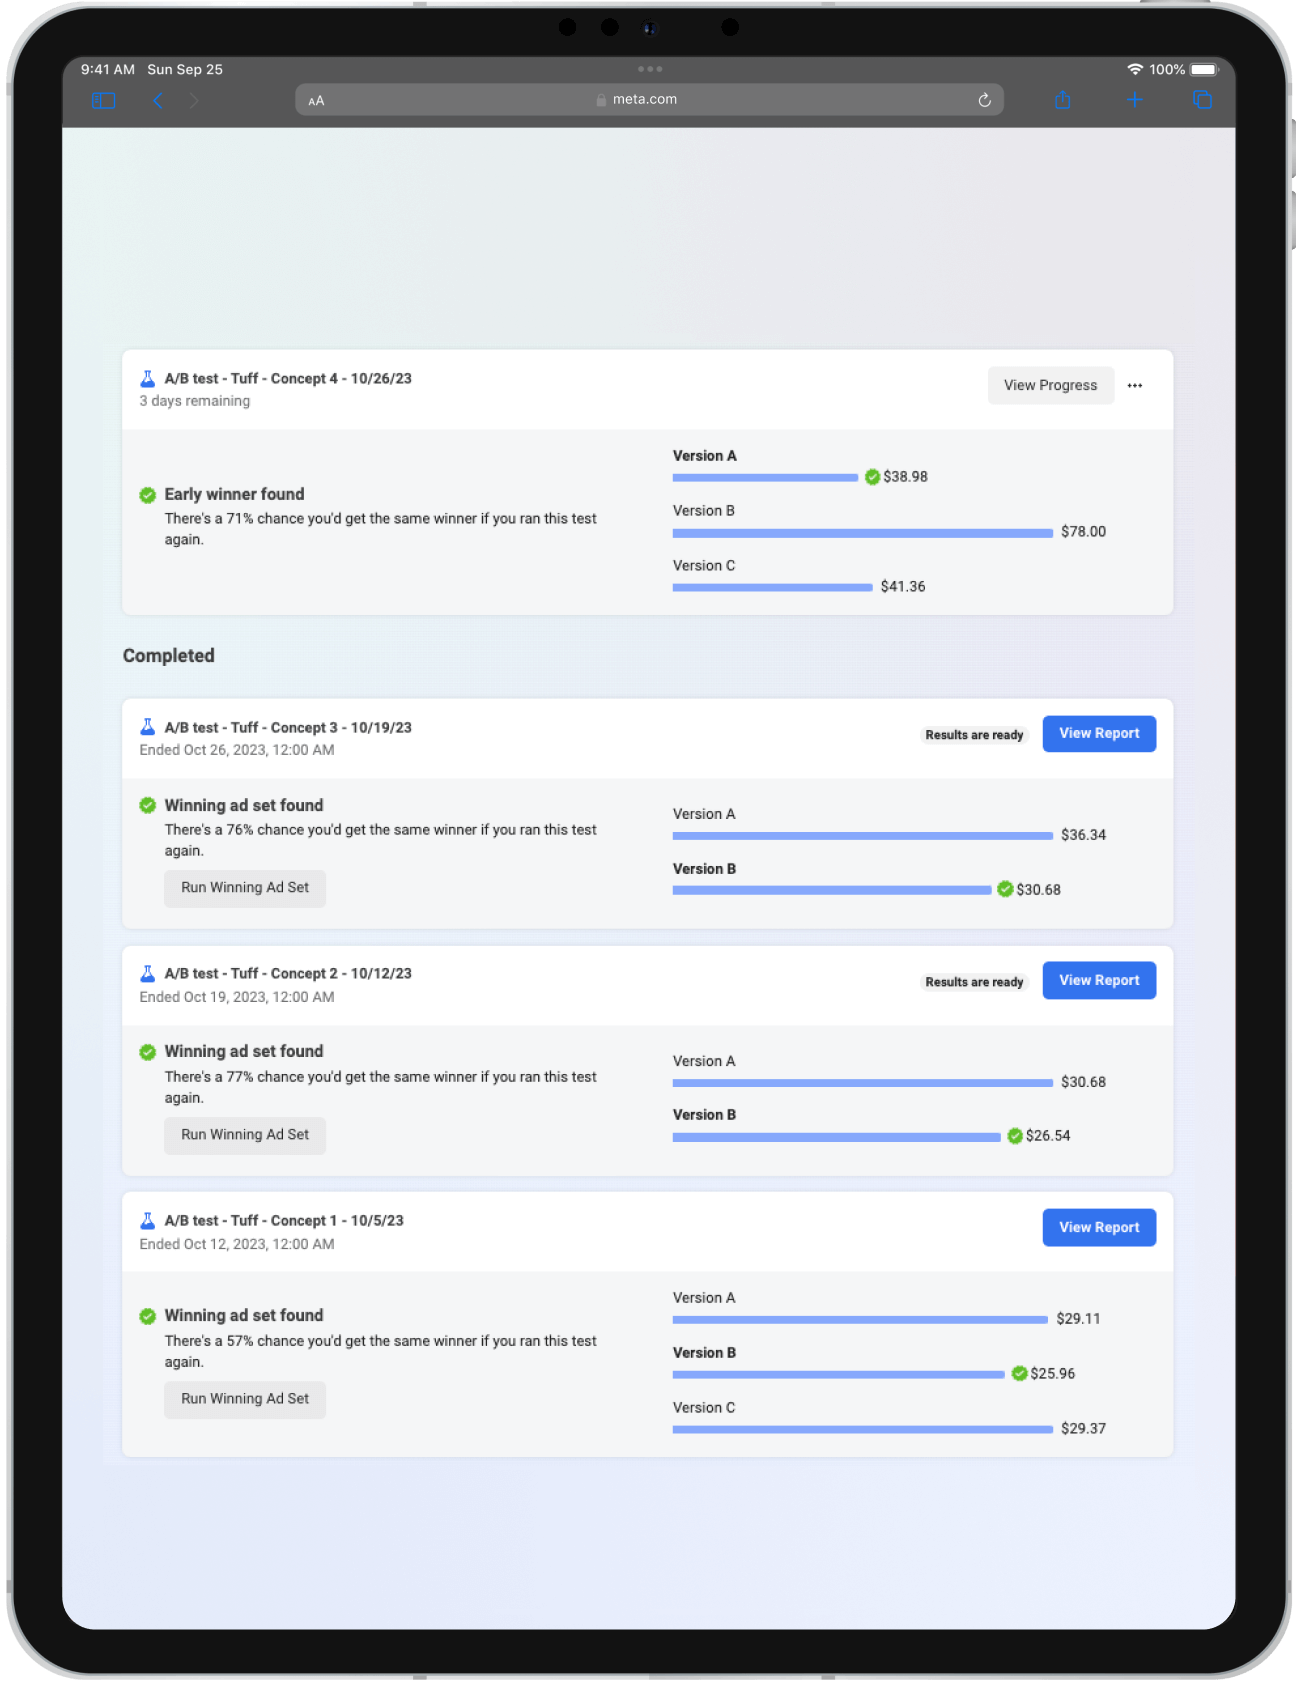
This is where the rubber meets the road. Once we strategically place your creative within campaigns on each platform, we’ll let them run their course until we’ve gathered a solid batch of statistically relevant data. This data becomes our compass, guiding us in making informed decisions about what’s hitting the mark and what needs some fine-tuning.
With larger budgets, we can typically kick off our first analysis within a week. But for more modest spends, we give the creative a bit more runway (often a few weeks) before we dive deep into our analysis. Regardless of the spend size, our dedicated media strategists remain hands-on, making constant optimizations to ensure we get the very best results.
And the best part? This process doesn’t stop here. It repeats, refines, and repeats again until we’ve got a tried-and-true formula for crafting assets that consistently drive exceptional media results.
To see this entire process in action, take a peek at our success story with soona. We managed to slash their CPA on Meta by over $200 through our creative testing process. It’s a prime example of how we can make a real impact on your advertising goals with the right strategy.
To set up a successful A/B test for media campaigns and effectively test creative, the creative and media teams must collaborate closely. These teams need to work seamlessly together as one integrated unit.
Often, brands may rely on the creative team solely for assets and the media team solely for campaign management. In reality, the best results are achieved when these two teams work hand in hand. Creatives must have a deep understanding of the media plan, audience strategy, and platform allocations. After all, how can they design assets that truly resonate with the right audience, platform, or spending level if they don’t have this knowledge?
The same holds true for the media team. They need to grasp the message testing strategy, understand the number of concepts the creative team is developing, and design a campaign plan that not only facilitates creative testing but also allows for scalable growth once a winning approach is identified.
The all-too-common scenario of media and creative teams working in isolation can lead to serious financial consequences. To avoid this, maintaining open feedback loops and encouraging collaboration between these teams has never been more critical.
Here’s the process we follow when crafting a campaign strategy that yields the best media results and enables effective creative testing:
The goal of this guide is to give marketers and growth teams practical tactics, strategies, and templates for an immediate boost in creative performance. However, it’s important to acknowledge that achieving the best results still requires substantial expertise, time, and resources.
If you’re prepared to harness the full power of a high-performance creative team to supercharge your results in the upcoming year, we’re all set to get started.
By scheduling a strategy session with Tuff, we can dive deep into the challenges your company is up against and the needs of your customers. From there, we can get to work on creating high-ROI ad campaigns that effortlessly maximize your media spend.
Your compounding growth curve begins here.

![]()
![]()
![]()
![]()